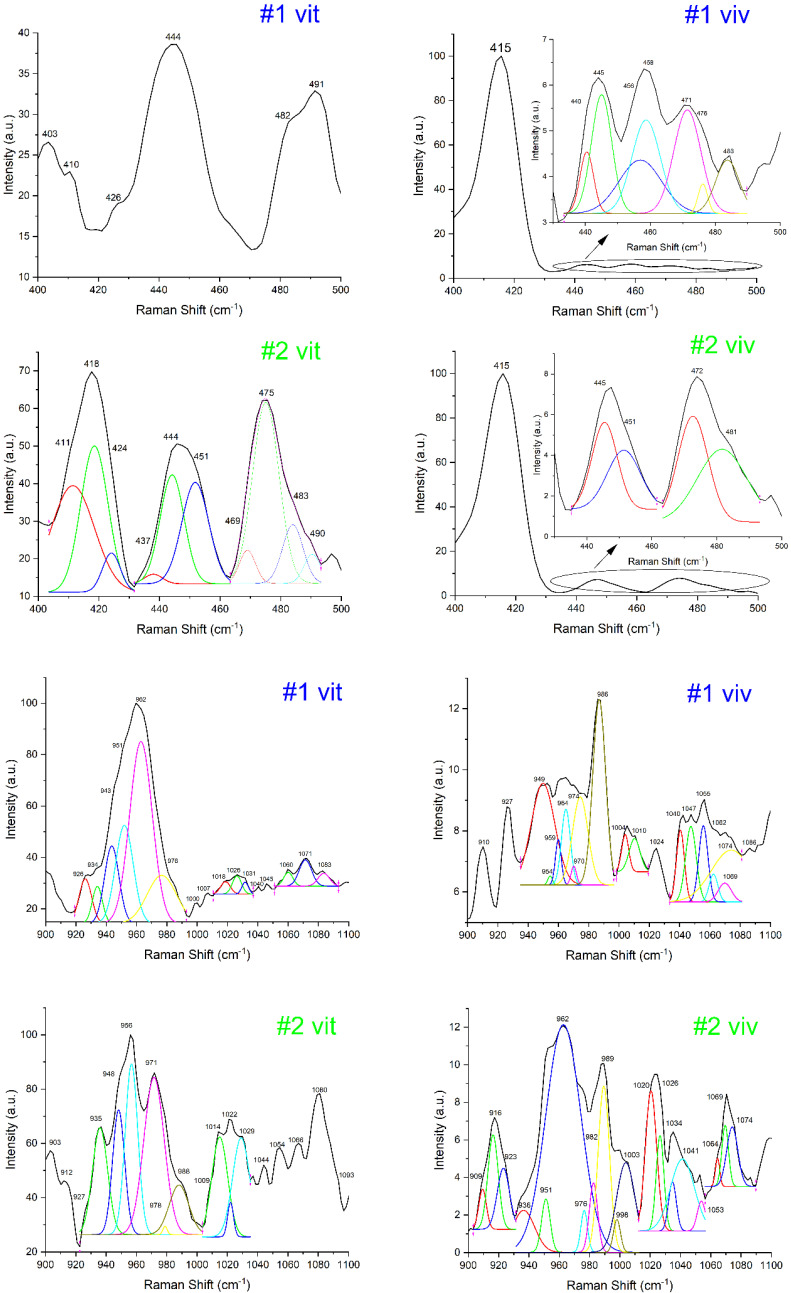
Figure 1.
Raman spectra shown for patients 1 and 2. The spectra were accumulated both in vitro and in vivo, analyzed in two windows: 400–500 cm−1 and 900–1100 cm−1, presented as processed data and after deconvolution (new peaks, with different colors). The rest of the Raman spectra (patients 3–10) are presented in the Supplementary File. The numbering stands for: # patient no. in vivo/in vitro.

