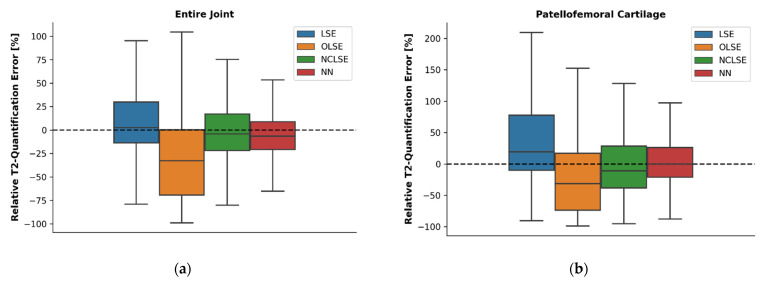
Figure 2.
Relative T2 quantification errors (RQEs) [%] as a function of fitting method in the entire joint (a) and the patellofemoral cartilage (b) across all seven knee joint specimens in the “low-SNR” data, computed with respect to the reference T2 relaxation times. The reference T2 relaxation times were estimated using the LSE fitting method and the corresponding “high-SNR” image. For an explanation of the boxes, lines, and whiskers please refer to Figure 1.

