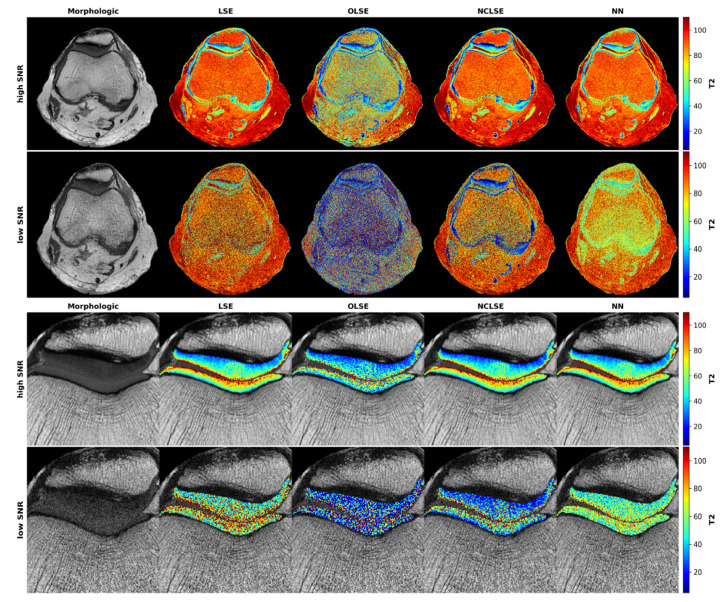
Figure 3.
Representative T2 maps as a function of signal-to-noise ratio (SNR) and underlying fitting method. Visualization of the axial plane acquired at high SNR (first row) and at low SNR (second row) of the entire joint that was cropped and zoomed to the patellofemoral compartment (third and fourth rows for high- and low-SNR images) in this representative knee joint. The first column shows the T2-weighted morphologic images (TE = 30 ms). The second to fifth columns visualize the T2 maps following fitting based on the Least-Squares Estimation (LSE, second column), Offset LSE (OLSE, third column), Noise-Corrected LSE (NCLSE, fourth column), and the Neural Network (NN, fifth column). T2 relaxation times [ms] are color-coded as indicated by the scale bars on the right (range: 0–110 ms).

