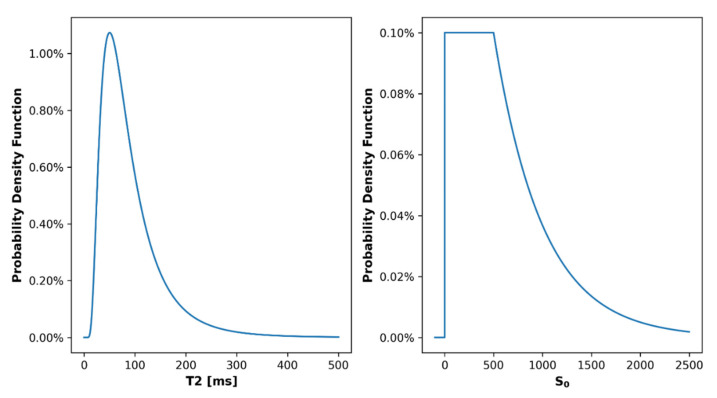
Figure A1.
Visualization of the probability density distributions used to sample T2 relaxation times and signal intensities (S0) for the synthetic dataset. The T2 relaxation times were sampled from a log-normal distribution with and probability density function . The signal intensities followed a customized probability density function , which was defined as: for ; for ; for .

