. 2022 Mar 7;11:e73360. doi: 10.7554/eLife.73360

Figure 4. Cholinergic neuron-specific TIGAR knockout mice recapitulate the protection against hypothermia of the whole-body TIGAR-deficient mice.

(A) Representative immunofluorescent images showing TIGAR, vesicular acetylcholine transporter (VAChT), and nuclei (DAPI) in the superior cervical ganglions (SCGs) from the control ChatCre and cholinergic neuron-specific Tigar knockout (chTKO) male mice. (B) Representative TIGAR, choline acetyltransferase (ChAT), and actin protein immunoblots of the SCG from two independent control ChatCre and chTKO male mice. (C) Male ChatCre and chTKO mice (n = 6) core body temperatures were measured every 15 min starting at ambient laboratory temperature (0 min) and following placement at 4°C. (D) Male ChatCre and chTKO mice (n = 6) were intraperitoneally injected with cyclopiazonic acid (CPA,10 mg/kg body weight) at room temperature and core body temperature measured every 15 min. (E) ChatCre and chTKO male mice (n = 6) were intraperitoneally injected with CPA (10 mg/kg body weight) at room temperature, shifted to 4°C, and core body temperature measured every 15 min. (F) Male ChatCre and chTKO mice (n = 6) were intraperitoneally injected with tubocurare (0.4 mg/kg body weight), and then core body temperature was measured every 15 min at room temperature. (G) ChatCre and chTKO mice (n = 6) were intraperitoneally injected with tubocurare (0.4 mg/kg body weight) at room temperature and 10 min later shifted to 4°C for 30 min. Core body temperature was measured every 10 minutes. (H) Representative TIGAR, c-Fos, VAChT, ChT, and actin protein immunoblots of the SCG from two independent control ChatCre and chTKO male mice at room temperature or shifted to 4°C for 30 min. Statistical analyses are described in ‘Method details,’ and the data are presented as the mean ± SD. *p<0.05, **p<0.01, ***p<0.001, ****p<0.0001.

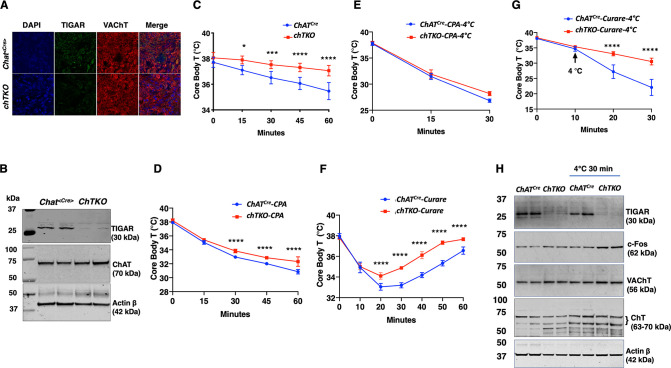
Figure 4—source data 1. The superior cervical ganglion (SCG) tissues were collected and snap-frozen in liquid nitrogen from the ChatCre and cholinergic neuron-specific Tigar knockout (chTKO) mice, as shown in Figure 4—figure supplement 1 for SCG dissection.
The SCGs from the three mice of the same strain were pooled and processed by beads homogenization to acquire tissue lysates. 15 μg of the tissue lysate were used for TIGAR (30 kDa) immunoblotting analysis as described in the ‘Immunoblotting’ section. The left four lanes of the raw image (lysate from the mice at ambient temperature) were used for Figure 4B to confirm the efficiency of TIGAR protein loss in SCG of the chTKO mice. A detailed description of the raw images is shown in Source data 1.
Figure 4—source data 2. The superior cervical ganglion (SCG) tissues were collected and snap-frozen in liquid nitrogen from the ChatCre and cholinergic neuron-specific Tigar knockout (chTKO) mice, as shown in Figure 4—figure supplement 1 for SCG dissection.
The SCGs from the three mice of the same strain were pooled and processed by beads homogenization to acquire tissue lysates. 15 μg of the tissue lysate were used for choline acetyltransferase (ChAT, 70 kDa) immunoblotting analysis as described in the ‘Immunoblotting’ section. The left four lanes of the raw image (lysate from the mice at ambient temperature) were used for Figure 4B. A detailed description of the raw images is shown in Source data 1.
Figure 4—source data 3. The superior cervical ganglion (SCG) tissues were collected and snap-frozen in liquid nitrogen from the ChatCre and cholinergic neuron-specific Tigar knockout (chTKO) mice, as shown in Figure 4—figure supplement 1 for SCG dissection.
The SCGs from the three mice of the same strain were pooled and processed by beads homogenization to acquire tissue lysates. 15 μg of the tissue lysate were used for actin β (42 kDa) immunoblotting analysis as described in the ‘Immunoblotting’ section. The left four lanes of the raw image (lysate from the mice at ambient temperature) were used for Figure 4B. A detailed description of the raw images is shown in Source data 1.
Figure 4—source data 4. The superior cervical ganglion (SCG) tissues were collected and snap-frozen in liquid nitrogen from both ambient temperature housed and 4°C 30 min exposed ChatCre and cholinergic neuron-specific Tigar knockout (chTKO) mice, as shown in Figure 4—figure supplement 1 for SCG dissection.
The SCGs from the three mice of the same strain were pooled and processed by beads homogenization to acquire tissue lysates. 15 μg of the tissue lysate were used for TIGAR (30 kDa) immunoblotting analysis as described in the ‘Immunoblotting’ section. The right eight lanes of the raw image (lysate from SCG tissues) was used for Figure 4H to confirm the efficiency of TIGAR protein loss in SCG of the chTKO mice. The left two lanes of the raw immunoblotting image represent the lysates of soluble fraction (RIPA lysis buffer extracted) of whole-brain tissues from the ChatCre and chTKO mice, respectively. A detailed description of the raw images is shown in Source data 1.
Figure 4—source data 5. The superior cervical ganglion (SCG) tissues were collected and snap-frozen in liquid nitrogen from both ambient temperature housed and 4°C 30 min exposed ChatCre and cholinergic neuron-specific Tigar knockout (chTKO) mice, as shown in Figure 4—figure supplement 1 for SCG dissection.
The SCGs from the three mice of the same strain were pooled and processed by beads homogenization to acquire tissue lysates. 15 μg of the tissue lysate were used for c-Fos (62 kDa) immunoblotting analysis as described in the ‘Immunoblotting’ section. The right eight lanes of the raw image (lysate from SCG tissues) were used for Figure 4H to show the increase in c-Fos protein in SCG of the chTKO mice under cold exposed. The left two lanes of the raw immunoblotting image represent the lysates of soluble fraction (RIPA lysis buffer extracted) of whole-brain tissues from the ChatCre and chTKO mice, respectively. A detailed description of the raw images is shown in Source data 1.
Figure 4—source data 6. The superior cervical ganglion (SCG) tissues were collected and snap-frozen in liquid nitrogen from both ambient temperature housed and 4°C 30 min exposed ChatCre and cholinergic neuron-specific Tigar knockout (chTKO) mice, as shown in Figure 4—figure supplement 1 for SCG dissection.
The SCGs from the three mice of the same strain were pooled and processed by beads homogenization to acquire tissue lysates. 15 μg of the tissue lysate were used for vesicular acetylcholine transporter (VAChT, 55 kDa) immunoblotting analysis as described in the ‘Immunoblotting’ section. The right eight lanes of the raw image (lysate from SCG tissues) were used for Figure 4H to show VAChT protein in the SCGs. The left two lanes of the raw immunoblotting image represent the lysates of soluble fraction (RIPA lysis buffer extracted) of whole-brain tissues from the ChatCre and chTKO mice, respectively. A detailed description of the raw images is shown in Source data 1.
Figure 4—source data 7. The superior cervical ganglion (SCG) tissues were collected and snap-frozen in liquid nitrogen from both ambient temperature housed and 4°C 30 min exposed ChatCre and cholinergic neuron-specific Tigar knockout (chTKO) mice, as shown in Figure 4—figure supplement 1 for SCG dissection.
The SCGs from the three mice of the same strain were pooled and processed by beads homogenization to acquire tissue lysates. 15 μg of the tissue lysate were used for choline transporter (ChT, 55 kDa) immunoblotting analysis as described in the ‘Immunoblotting’ section. The right eight lanes of the raw image (lysate from SCG tissues) were used for Figure 4H to show ChT protein in that 63 and 70 kDa bands were observed in the SCGs. The left two lanes of the raw immunoblotting image represent the lysates of soluble fraction (RIPA lysis buffer extracted) of whole-brain tissues from the ChatCre and chTKO mice, respectively. A detailed description of the raw images is shown in Source data 1.
Figure 4—source data 8. The superior cervical ganglion (SCG) tissues were collected and snap-frozen in liquid nitrogen from both ambient temperature housed and 4°C 30 min exposed ChatCre and cholinergic neuron-specific Tigar knockout (chTKO) mice, as shown in Figure 4—figure supplement 1 for SCG dissection.
The SCGs from the three mice of the same strain were pooled and processed by beads homogenization to acquire tissue lysates. 15 μg of the tissue lysate were used for actin β (42 kDa) immunoblotting analysis as described in the ‘Immunoblotting’ section. The right eight lanes of the raw image (lysate from SCG tissues) were used for Figure 4H to show actin β protein in the SCGs. The left two lanes of the raw immunoblotting image represent the lysates of soluble fraction (RIPA lysis buffer extracted) of whole-brain tissues from the ChatCre and chTKO mice, respectively. A detailed description of the raw images is shown in Source data 1.

Figure 4.

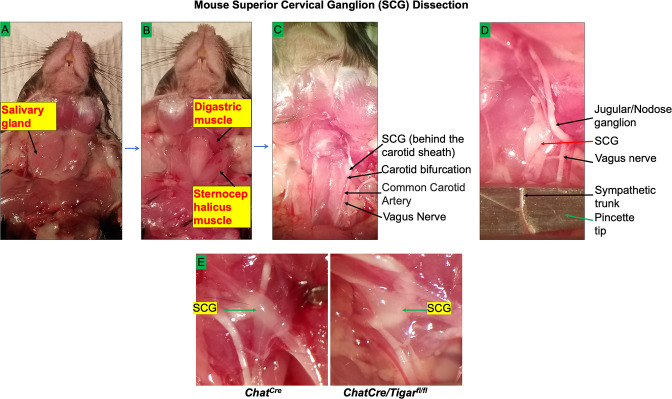
Figure 4—figure supplement 1. Mouse superior cervical ganglion (SCG) dissection.

Figure 4—figure supplement 1.

(A) The mouse ventral midline of the neck up to the mandible was incised and the salivary glands were exposed. (B) The sternocephalicus and posterior belly digastric muscles were retracted after the removal of salivary glands. (C) The carotid bifurcation and carotid sheath were identified. (D) The SCG behind the carotid sheath was isolated, and the fresh SCGs in two sides were subjected to immunofluorescence imaging and Western blotting experiments for Figure 4. (E) A representative image of SCG from ChAT<Cre> and chTKO, respectively, is shown.

Figure 4—video 1. Cholinergic neuron-specific Tigar knockout (chTKO) mice are resistant to the paralytic effects of tubocurare.

Download video file (22.8MB, mp4)
Representative video clip of the control ChatCre and chTKO male mice behavior under ambient temperature and at 4°C following intraperitoneal injection of tubocurare (0.4 mg/kg body weight). Rectal temperature recording of ChatCre and chTKO mice with curare injection was performed on February 7, 2019. The date of birth of both ChatCre and chTKO mice was October 6, 2018. The body weights of ChatCre and chTKO were 25.4 g and 27.7 g, respectively. The volume of curare saline solution (0.1 mg/ml in saline) for intraperitoneal (IP) injection was 101.6 µl for the ChatCre mouse and 110.8 µl for the chTKO mouse. The mice were IP injected with curare, then caged at ambient temperature (21–23°C) for 10 min, and subsequently transferred into a pre-chilled cage in a cold chamber at 4°C for 20 min. The mice were taken back to the cages at ambient temperature (see the sketch below). Rectal temperature was recorded at the time of curare injection and every 10 min thereafter (see the table in the text). The mouse in the left cage is ChatCre, and the mouse in the right cage is chTKO.