. 2022 Mar 7;11:e73360. doi: 10.7554/eLife.73360

Figure 6. TIGAR deficiency increases acetylcholine biosynthesis and acetylcholine receptor clustering at the neuromuscular junction.

(A) Representative images of α-bungarotoxin immunofluorescent labeling of nicotinic acetylcholine receptor clusters in the extensor digitorium longus (EDL) muscle from wild type (WT) and whole-body Tigar knockout (TKO) mice. (B) Quantification of the number of nicotinic acetylcholine receptor clusters following 15 min exposure at 4°C (WT n = 17, TKO n = 13). These data represent the average of over six mice in each group of mean ± SD (unpaired t-test, two-tailed, **p=0.0035). (C) Acetylcholine levels in the gastrocnemius muscle of WT and TKO male (n = 7) mice at room temperature or following 1 hr at 4°C. (D) Acetylcholine levels in the gastrocnemius muscle of ChatCre and chTKO male (n = 6) mice at room temperature or following 1 hr at 4°C. (E) Representative immunoblots of TIGAR and actin proteins from two scrambled sgRNA and two Tigar sgRNA knockout Sh-SY5Y cell lines. (F) Acetylcholine concentrations in the medium of scrambled and TKO SH-SH5Y neuroblastoma cells. (G) m2 acetylcholine enrichments in cells labeled with d-glucose-1,2-13C2. (H) m2 acetylcholine enrichments in cells labeled with U-13C6 d-glucose. (I) m1 glutamate (m/z 128, C2-C4 fragment) enrichment in the medium of scrambled and TKO SH-SY5Y human neuroblastoma cells labeled with d-glucose-[1,2]-13 C2. Statistical analyses are described in ‘Method details,’ and the data are presented as the mean ± SD. *p<0.05, ***p<0.001, ****p<0.0001.

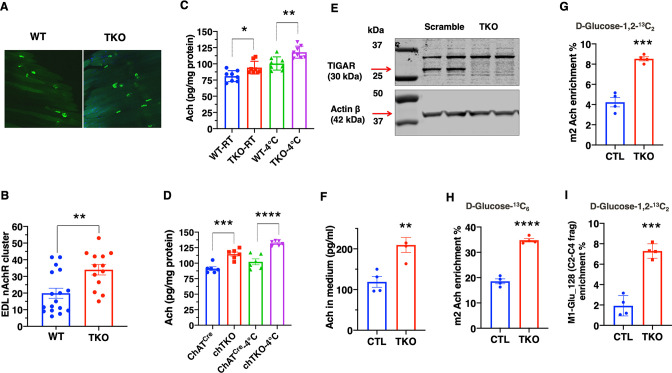
Figure 6—source data 1. The culture SH-SY5Y cells were collected from both scrambled and whole-body Tigar knockout (TKO) cells, and 30 μg of the cell lysates were used for TIGAR (30 kDa) immunoblotting analysis as described in the ‘Immunoblotting’ section.
The left four lanes of the raw image (lysate from neuroblastoma cells) were used for Figure 6E to confirm the efficiency of TIGAR protein loss in the SH-SY5Y neuroblastoma TKO cells. The right four lanes of the raw image represent the TIGAR immunoblotting of the cell lysates from 7-day differentiated neuroblastoma cells. A detailed description of the raw images is shown in Source data 1.
Figure 6—source data 2. The culture SH-SY5Y cells were collected from both scrambled and whole-body Tigar knockout (TKO) cells, and 30 μg of the cell lysates were used for actin β (42 kDa) immunoblotting analysis as described in the ‘Immunoblotting’ section.
The left four lanes of the raw image (lysate from neuroblastoma cells) were used for Figure 6E to show actin β protein in the SH-SY5Y neuroblastoma cells. The right four lanes of the raw image represent the actin β immunoblotting of the cell lysates from 7-day differentiated neuroblastoma cells. A detailed description of the raw images is shown in Source data 1.

Figure 6.

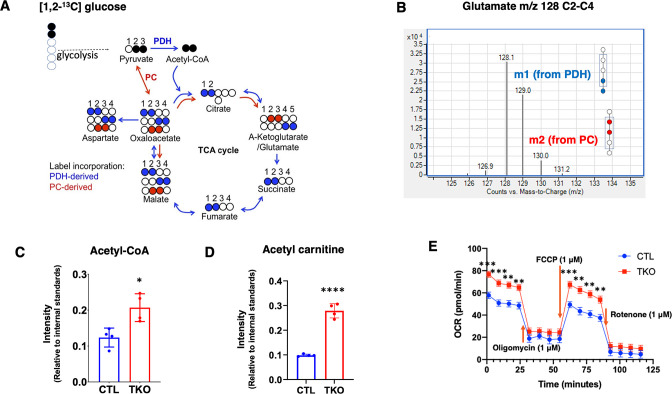
Figure 6—figure supplement 1. Summation of flux results through glycolysis and the TCA cycle using [1,2]–13C-glucose by assessing glutamate isotopomers.

Figure 6—figure supplement 1.

(A) [13]-13C-glucose becomes [2,3]-13C pyruvate if it is directly metabolized through the glycolytic pathway. [2,3]-13C-pyruvate can enter the TCA cycle through pyruvate dehydrogenase (PDH) or pyruvate carboxylase (PC). Blue dots indicate 13C carbons from glucose entering TCA cycle via PDH. Red dots indicate 13C carbons from glucose entering TCA cycle via PC. (B) Representative spectra of the glutamate C2-C4 fragments from TIGAR knockout SH-SY5Y cells labeled with d-glucose-[1,2]-13 C2. M0 of the C2-C4 glutamate fragment is m/z 128, m1 of glutamate is m/z 129 (blue) that indicates the presence of 13C at the fourth carbon position, and m2 glutamate indicates the presence of 13C at the second and third carbon positions (red). (C) The cellular acetyl-CoA and (D) acetyl-carnitine levels in SH-SY5Y cell pellets were measured as described in ‘Method details,’ and the data are presented as the mean ± SD. (E) Seahorse flux analyses of oxygen consumption rate (OCR) were performed as described in ‘Method details,’ and the data are presented as the mean ± SEM. Statistical analyses are described in ‘Method details.’ *p<0.05, **p<0.01, ***p<0.001, ****p<0.0001.
Figure 6—figure supplement 1—source data 1. Raw metabolites data including cellular acetyl-CoA and acetyl-carnitine were collected from SH-SY5Y control and whole-body Tigar knockout (TKO) cell pellet as described in ‘Method details’.
The data was used in Figure 6—figure supplement 1.