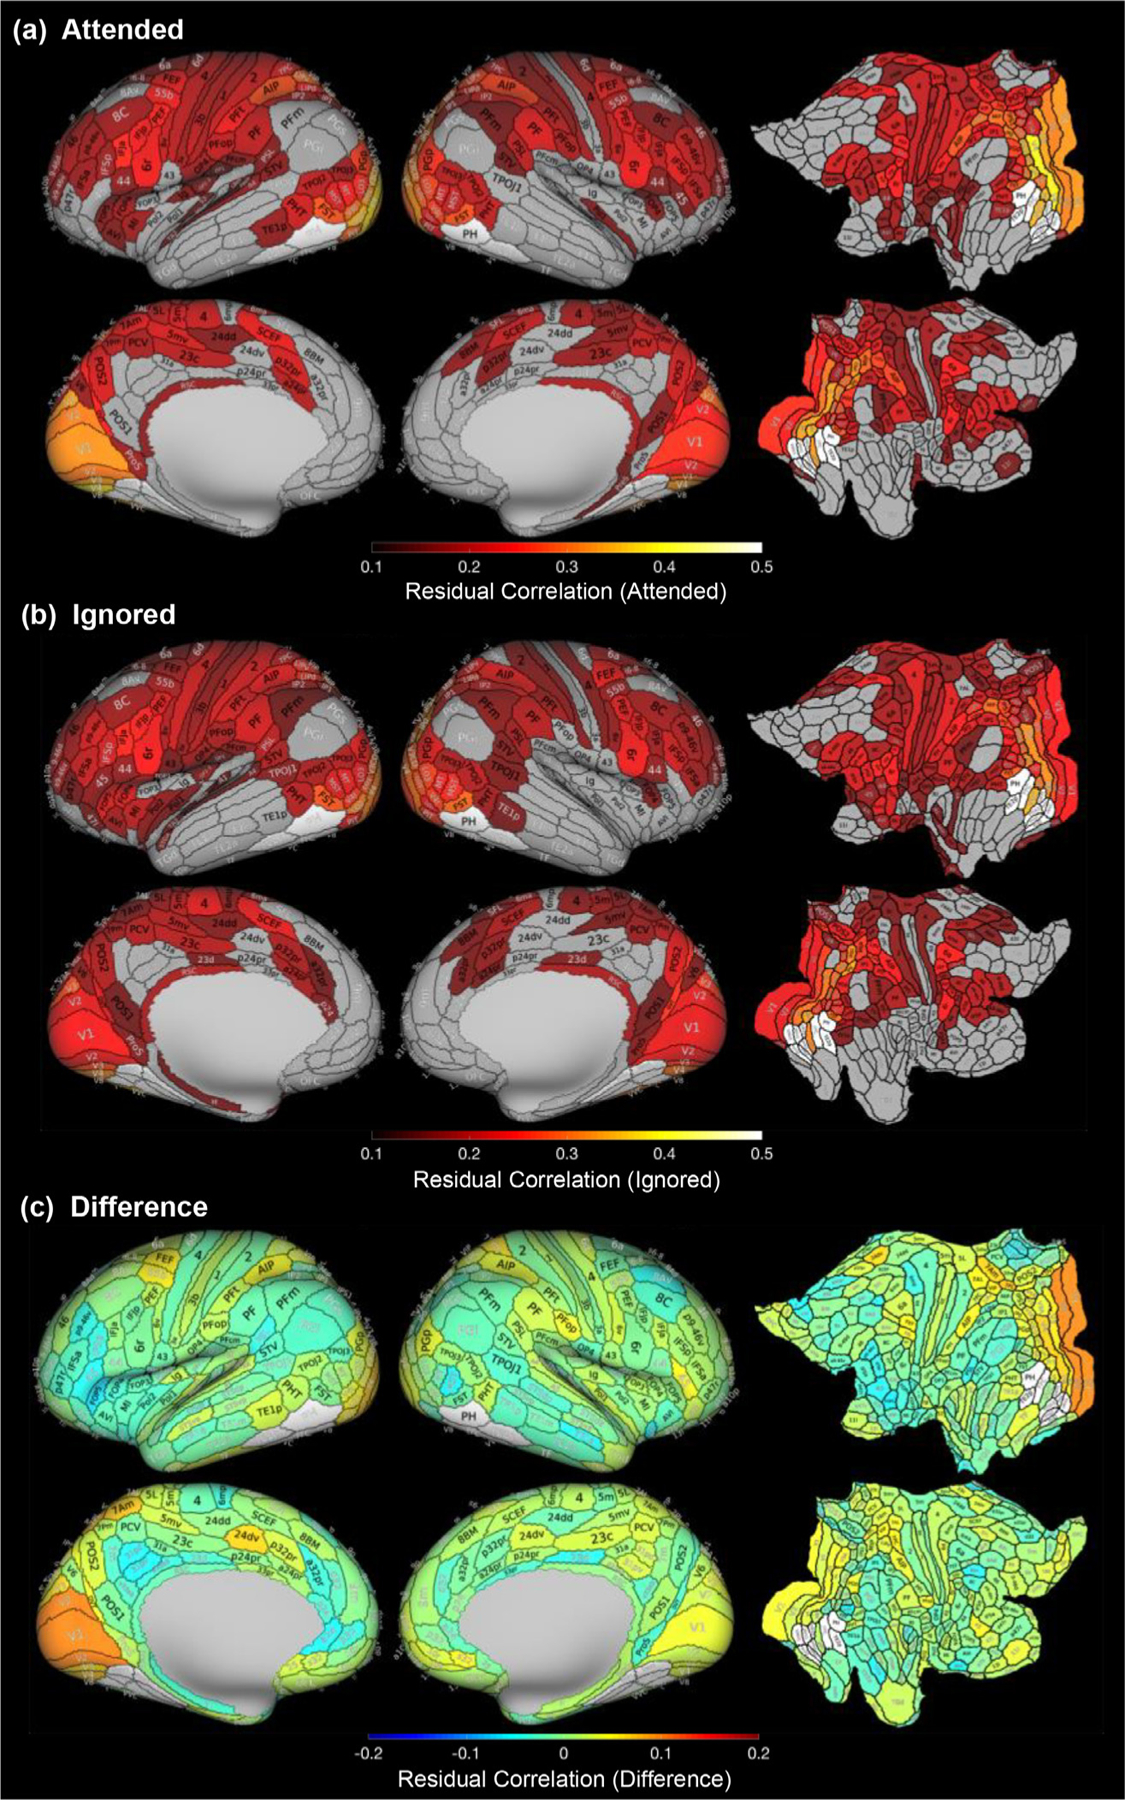
Fig. 4.

Comparisons of residual correlations with VTC category-selective regions during attended and ignored conditions. Mean correlations between residual activity in each Glasser ROI and residual activity in VTC category-selective regions, averaged across object categories and participants, in (a) the attended condition and (b) the ignored condition. Gray ROIs are those with residual correlations below 0.1. Colored ROIs are at least six standard deviations greater than chance level (0.01) for visualization purposes. (c) Mean difference between attended and ignored residual correlations. Visualization of these difference maps (c) depicting statistical significance for each ROI may be found in Supplementary Figure 6b. White indicates Glasser ROIs overlapping VTC category-selective ROIs which were excluded from analyses.
