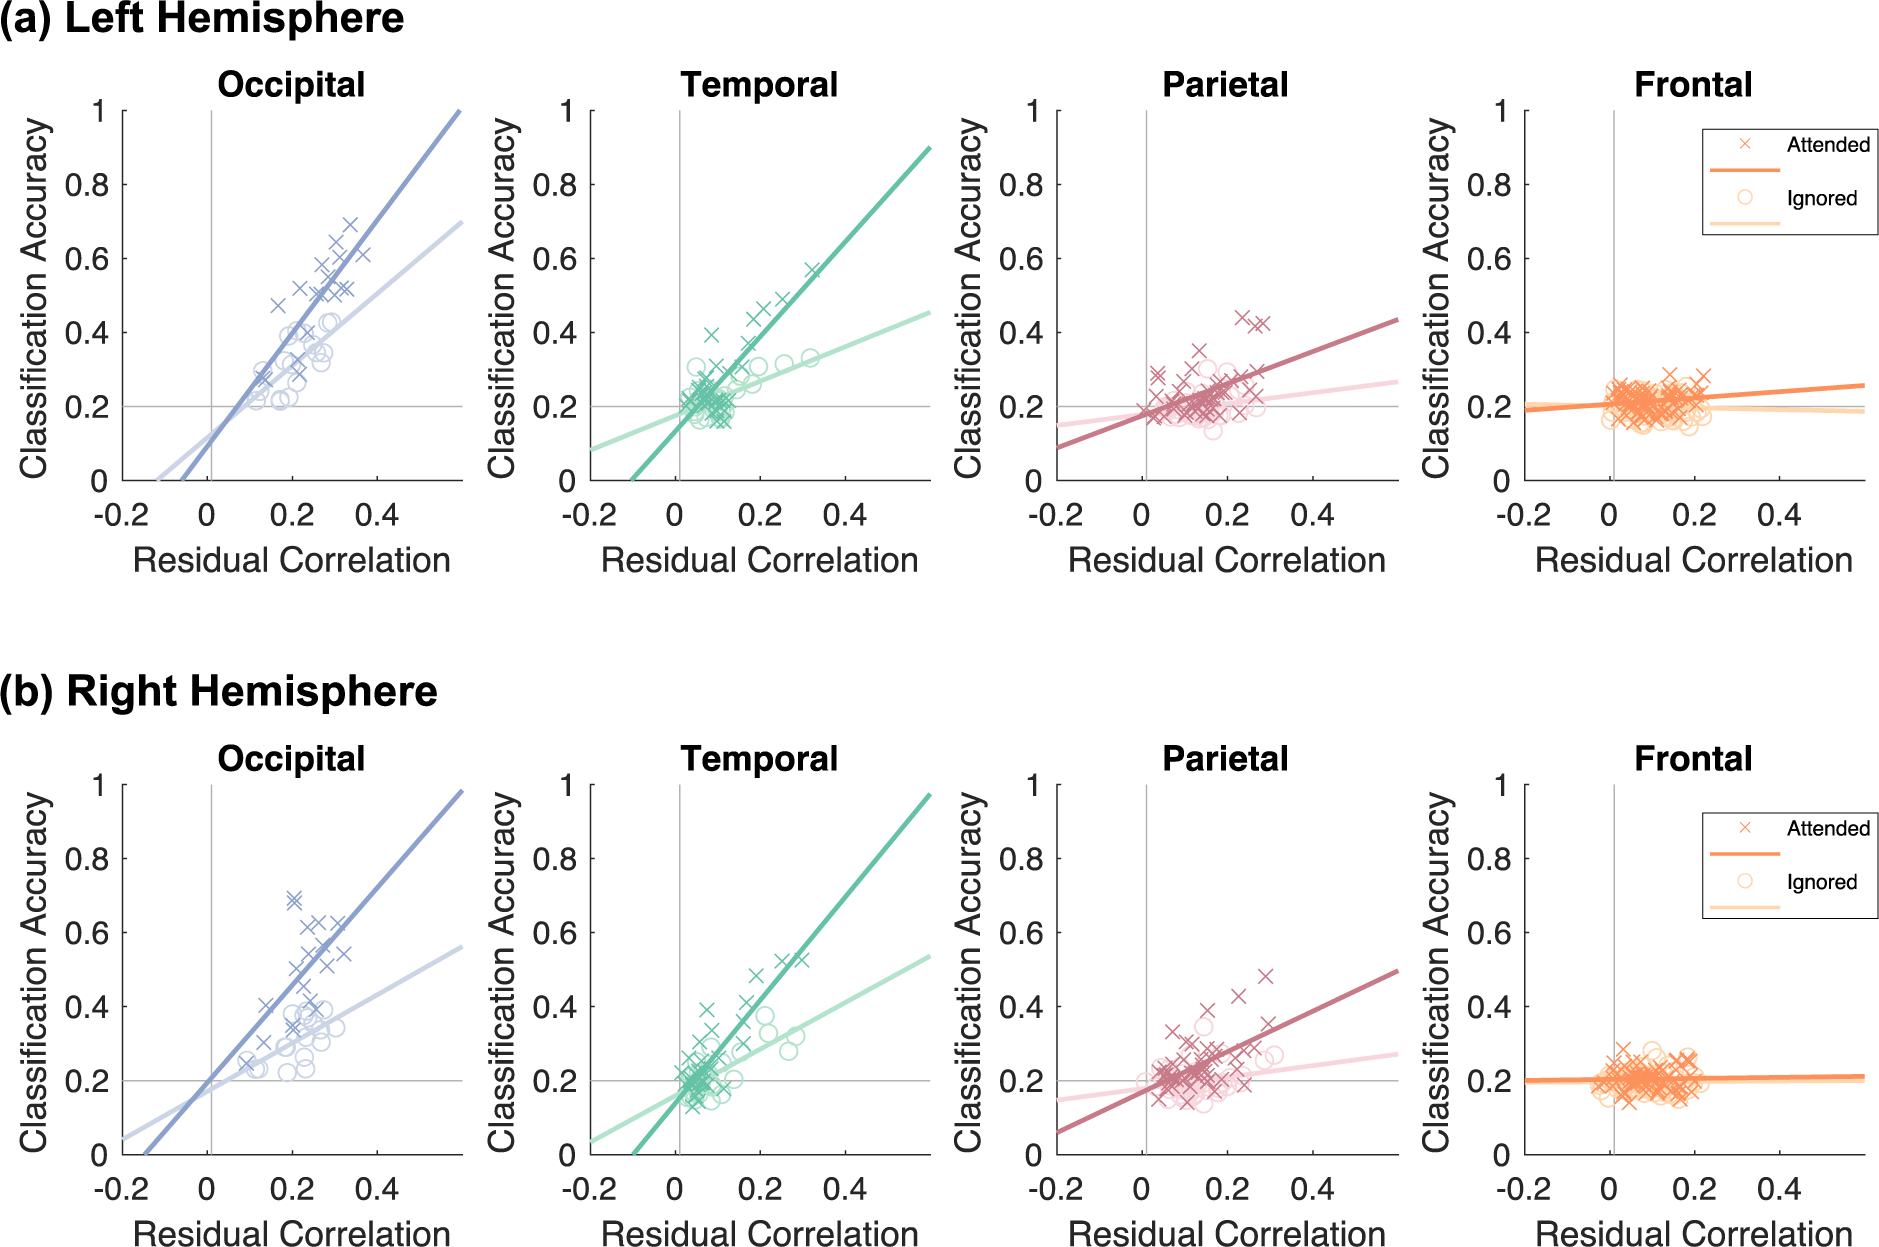
Fig. 6.

Attention enhances the correlation between classification accuracy and residual correlations. Each scatterplot depicts the relationship between mean classification accuracy (y-axis) and mean residual correlations (x-axis). Each point is a Glasser Atlas ROI marked by condition (dark-colored X’s: attended; light colored O’s: ignored). Data are shown separately for the (a) left hemisphere and (b) right hemisphere. Panels are arranged by lobe: blue: occipital; green: temporal; red: parietal; orange: frontal.
