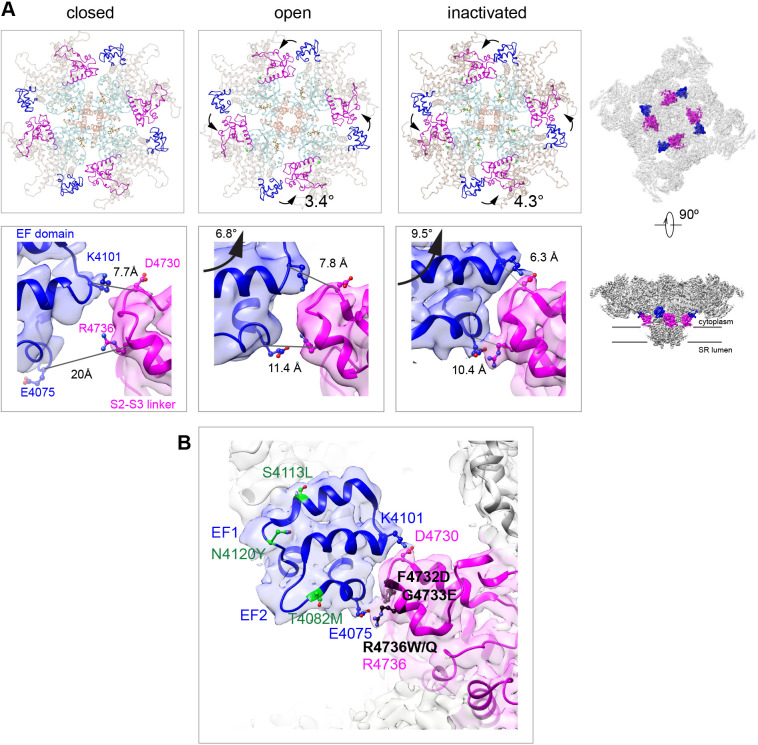
Figure 3. Two salt bridges between the EF hands and the S2–S3 loop are determinant for the inactivated state.
(A) Cytoplasmic sarcoplasmic reticulum (SR) view (top row) and side view (bottom row) highlighting the EF hand domain (blue) and S2–S3 loop (magenta) at the subunit interface. Counterclockwise in-plane and ascending out-of-plane rotations of the central region in the transition from RyR1-ACP/EGTA (closed) to RyR1-ACP/Ca2+ open brings the two domains closer together. Further rotation of the CD (tan color in top row) and its protruding EF hand domain in RyR1-ACP/Ca2+ inactivated brings the two domains in contact. The inter Cα-Cα contact distances illustrate the progressive approximation of the two domains. Two salt bridges, Lys4101-Asp4730 and Glu4075-Arg4736, form in the RyR1-ACP/Ca2+-inactivated conformation. The location of the domains in the context of RyR1 is shown on the right panels. (B) MH/CCD mutation sites in the interface between the EF hand domain and S2–S3 loop that abolish Ca2+-dependent inactivation (black) versus MH/CCD mutations without effect on inactivation (green). The two EF loops are indicated (EF1, EF2). Residues forming the salt bridges are labeled according to domain color. R4736, directly forming the salt bridge, is susceptible to MH mutation.

