. 2022 Feb 10;11:e70493. doi: 10.7554/eLife.70493

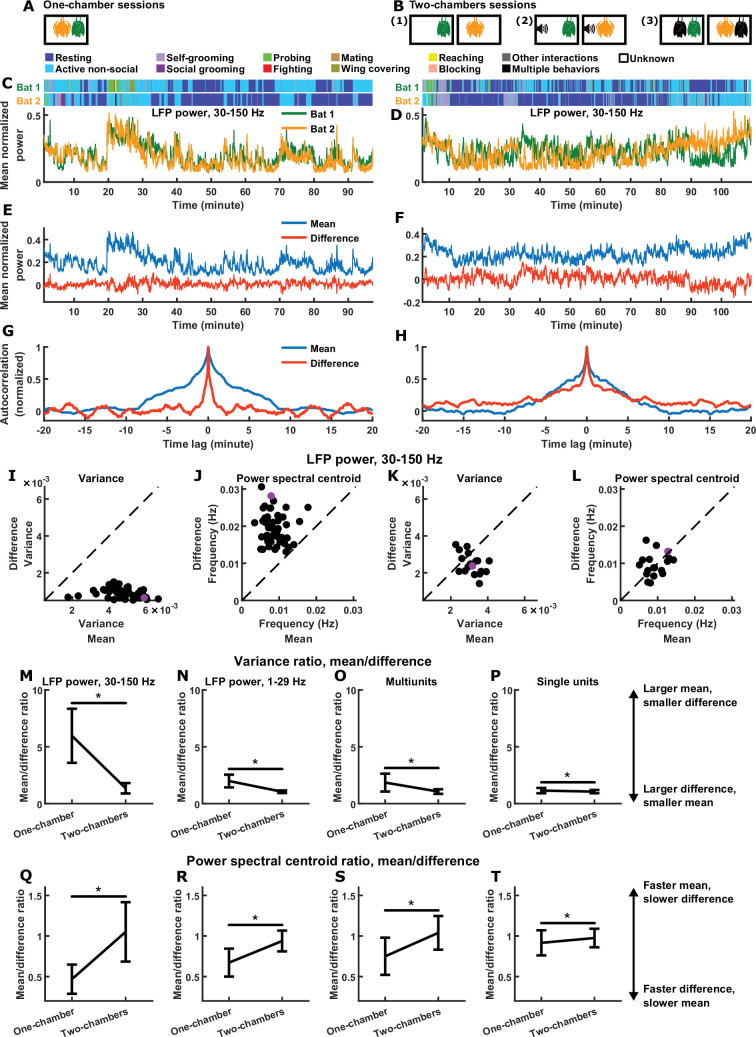
Figure 1. Relative magnitudes and timescales of the inter-brain difference and mean components.

(A) In each one-chamber session, two bats freely interacted with each other while neural activity was wirelessly recorded simultaneously from their frontal cortices. (B) In each two-chambers session, the same bats from the one-chamber sessions freely behaved in separate, identical chambers, while neural activity continued to be simultaneously and wirelessly recorded from their frontal cortices. Two-chambers sessions included three conditions: (1) two bats each freely behaving in isolation; (2) two bats each freely behaving while listening to identical auditory stimuli; (3) two bats each freely behaving and interacting with a different partner in separate chambers. (C)-(D) Mean normalized LFP power in the 30–150 Hz band (Materials and methods), averaged across all channels for each bat, on an example one-chamber session (C) and an example two-chambers session (D). Shown above are the behaviors of the two bats as a function of time, which were manually annotated frame-by-frame from recorded video. The example two-chambers session was of the third type illustrated in (B). (E) The neural activity of the two bats from (C) after a change of basis, showing the mean and difference between bats. At a given time t, the mean and difference components are defined as 12[a1(t)+a2(t)] and 12[a1(t)a2(t)], respectively, where a1(t) and a2(t) are respectively the neural activity of bat 1 and bat 2 plotted in (C). Note that the mean component had a large variance, whereas the difference component had a small variance, hovering around zero. (F) Same as (E), but for the example session from (D). Note that the variances are more comparable between the mean and difference components. (G) Autocorrelations (peak-normalized) of the mean and difference components shown in (E). The autocorrelations were computed after subtracting from each time series its average over time. Note that the difference component varied on faster timescales than the mean component. (H) Same as (G), but for the example session from (D). Note that the timescales are more comparable between the mean and difference components. (I)-(J) Variance (I) and power spectral centroid (J) of mean normalized 30–150 Hz LFP power, for the mean and difference components. Each dot is a single one-chamber session (the purple dot is the session shown in (C), (E), and (G)). Variance quantifies activity magnitude, and power spectral centroid quantifies timescale (higher centroids mean faster timescales). Note that, on every one-chamber session, the difference component was smaller and faster than the mean component. The dotted lines are unity. Note that the power spectral centroid was calculated from time series of mean normalized LFP power (e.g., as plotted in (E)), not from time series of LFP itself. (K)-(L) Same as (I)-(J), but for two-chambers sessions. The purple dot is the session shown in (D), (F), and (H). The mean and difference components have comparable magnitudes and timescales in the two-chambers sessions. (M)-(P) The average variance ratio (mean component variance divided by difference component variance) for mean normalized 30–150 Hz LFP power (M), mean normalized 1–29 Hz LFP power (N), multiunits (O), and single units (P). The averages were taken across sessions for LFP power, and across unit pairs (pooled from all sessions) for multiunits and single units. Error bars denote standard deviations. *, p < 0.05, Wilcoxon rank sum test. (Q)-(T) Same as (M)-(P), but for average power spectral centroid ratio (mean component centroid divided by difference component centroid). Note that, for all four neural signals, the difference component was smaller and faster than the mean component on one-chamber sessions. See Figure 1—figure supplements 24 for examples and detailed results for 1–29 Hz LFP power, multiunits, and single units.

Figure 1.

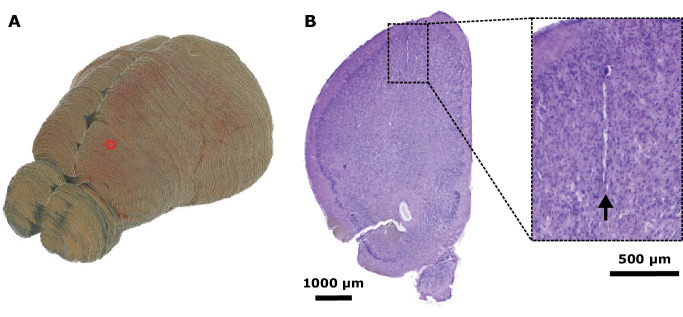
Figure 1—figure supplement 1. Neural recording location.

Figure 1—figure supplement 1.

(A) An example bat brain reconstructed from block-face imaging, with the electrode location in frontal cortex indicated by a red circle. (B) Left: an example Nissl-stained coronal section, at the location of the red circle in (A), showing a tetrode track (dashed box). Right: zoomed-in view showing the tetrode track (arrow).
© 2019, Elsevier
Figure 1—figure supplement 1 is reprinted from Figure S1 from Zhang and Yartsev, 2019, with permission from Elsevier. It is not covered by the CC-BY 4.0 license and further reproduction of this panel would need permission from the copyright holder.
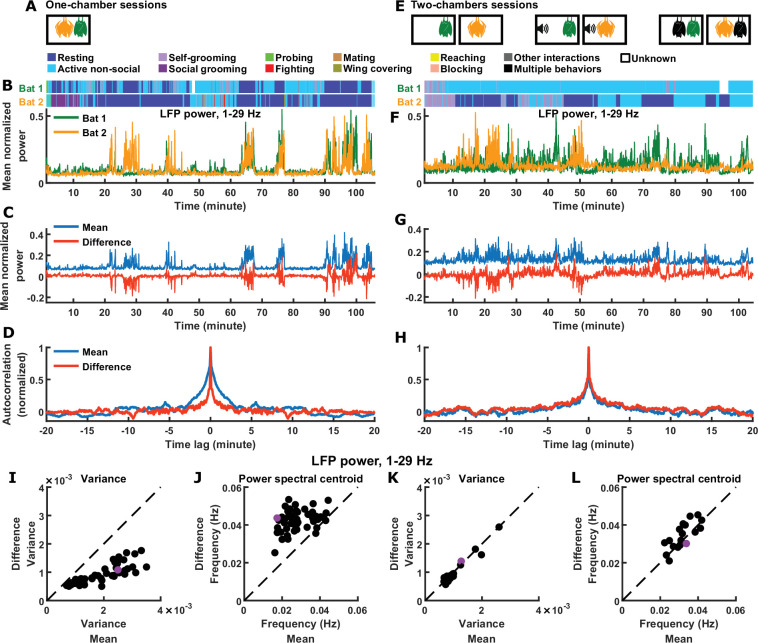
Figure 1—figure supplement 2. Inter-brain difference and mean components: 1–29 Hz LFP power.

Figure 1—figure supplement 2.

(A) One-chamber sessions: simultaneous neural recording from pairs of bats engaged in natural social interactions. (B) Mean normalized LFP power in the 1–29 Hz band (Materials and methods), averaged across all channels for each bat, on an example one-chamber session. Shown above are the annotated behaviors. (C) The mean and difference components of the activity of the two bats shown in (B). (D) Autocorrelations (peak-normalized) of the mean and difference activity components shown in (C). The autocorrelations were computed after subtracting from each time series its average over time. Note that the difference component varied on faster timescales than the mean component. (E) Two-chambers sessions: simultaneous neural recording from the same bats from the one-chamber sessions freely behaving in separate, identical chambers. (F)-(H) Same as (B)-(D), but for an example two-chambers session. (I)-(J) Variance (I) and power spectral centroid (J) of mean normalized 1–29 Hz LFP power, for the mean and difference components. Each dot is one one-chamber session (the purple dot is the session shown in (B)-(D)). Variance quantifies activity magnitude, and power spectral centroid quantifies timescale (higher centroids mean faster timescales). Note that, on one-chamber sessions, the difference component tends to be smaller and faster than the mean component. The dotted lines are unity. Note that the power spectral centroid was calculated from time series of mean normalized LFP power (e.g. as plotted in (C)), not from time series of LFP itself. (K)-(L) Same as (I)-(J), but for two-chambers sessions. The purple dot is the session shown in (F)-(H). The mean and difference components have comparable magnitudes and timescales on the two-chambers sessions.
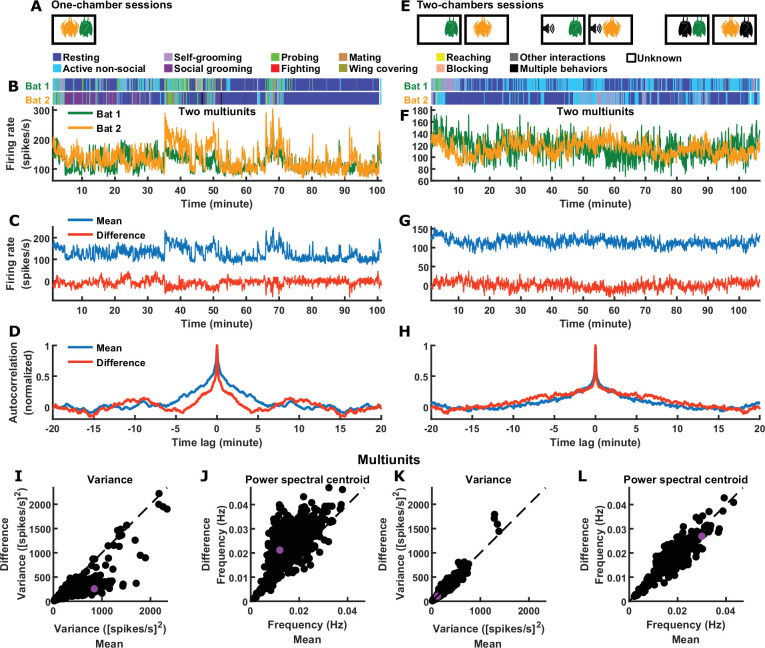
Figure 1—figure supplement 3. Inter-brain difference and mean components: multiunit activity.

Figure 1—figure supplement 3.

(A) One-chamber sessions: simultaneous neural recording from pairs of bats engaged in natural social interactions. (B) Activity of two multiunits, one from each brain, on an example one-chamber session. Shown above are the annotated behaviors. (C) The mean and difference components of the activity of the two bats shown in (B). (D) Autocorrelations (peak-normalized) of the mean and difference activity components shown in (C). The autocorrelations were computed after subtracting from each time series its average over time. Note that the difference component varied on faster timescales than the mean component. (E) Two-chambers sessions: simultaneous neural recording from the same bats from the one-chamber sessions freely behaving in separate, identical chambers. (F)-(H) Same as (B)-(D), but for an example two-chambers session. (I)-(J) Variance (I) and power spectral centroid (J) of multiunit activity, for the mean and difference components. Each dot is one pair of multiunits (one from each brain) from one-chamber sessions (the purple dot is the pair shown in (B)-(D)). Variance quantifies activity magnitude, and power spectral centroid quantifies timescale (higher centroids mean faster timescales). Note that, on one-chamber sessions, the difference component tends to be smaller and faster than the mean component. The dotted lines are unity. (K)-(L) Same as (I)-(J), but for two-chambers sessions. The purple dot is the pair of multiunits shown in (F)-(H). The mean and difference components have comparable magnitudes and timescales on the two-chambers sessions.
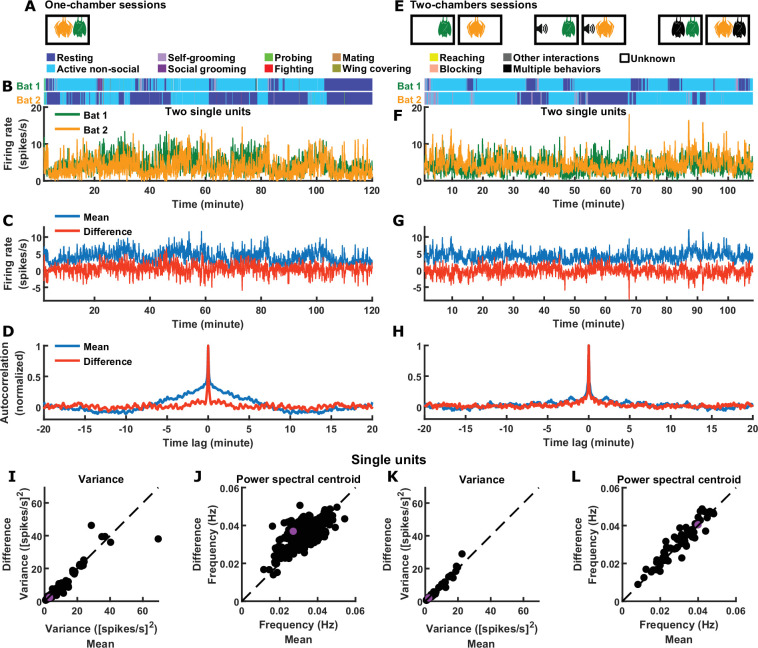
Figure 1—figure supplement 4. Inter-brain difference and mean components: single unit activity.

Figure 1—figure supplement 4.

(A) One-chamber sessions: simultaneous neural recording from pairs of bats engaged in natural social interactions. (B) Activity of two single units, one from each brain, on an example one-chamber session. Shown above are the annotated behaviors. (C) The mean and difference components of the activity of the two bats shown in (B). (D) Autocorrelations (peak-normalized) of the mean and difference activity components shown in (C). The autocorrelations were computed after subtracting from each time series its average over time. (E) Two-chambers sessions: simultaneous neural recording from the same bats from the one-chamber sessions freely behaving in separate, identical chambers. (F)-(H) Same as (B)-(D), but for an example two-chambers session. (I)-(J) Variance (I) and power spectral centroid (J) of single unit activity, for the mean and difference components. Each dot is one pair of single units (one from each brain) from one-chamber sessions (the purple dot is the pair shown in (B)-(D)). Variance quantifies activity magnitude, and power spectral centroid quantifies timescale (higher centroids mean faster timescales). The dotted lines are unity. (K)-(L) Same as (I)-(J), but for two-chambers sessions. The purple dot is the pair of single units shown in (F)-(H).