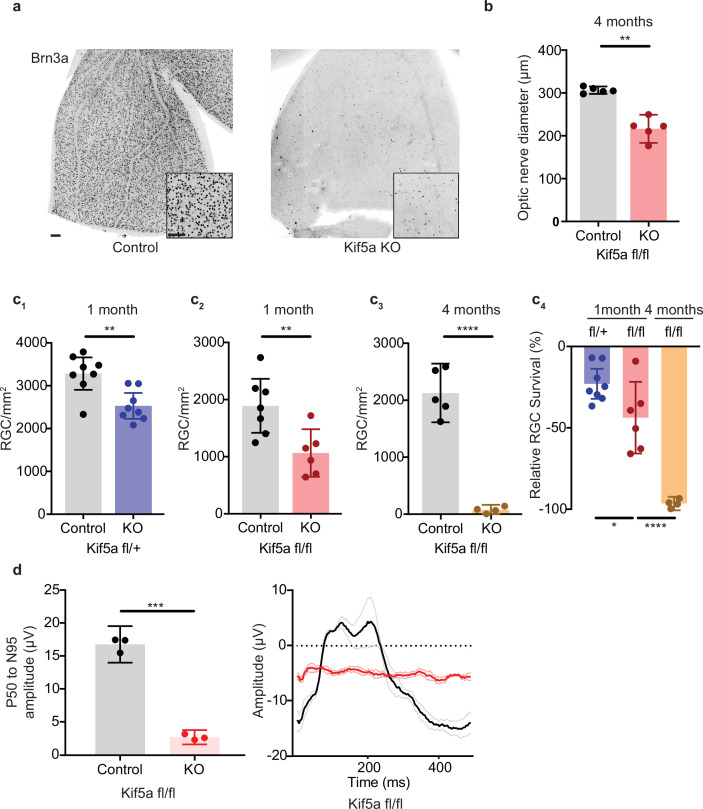
Figure 6. Kif5a knockout (KO) leads to progressive, dose-dependent retinal ganglion cell (RGC) degeneration.
(a) Representative example of wholemount Kif5afl/fl retinas stained with RGC-specific marker Brn3a, 4 months after either intravitreal adeno-associated virus (AAV)-GFP or AAV-Cre-GFP. Scale bar = 100 µm for both wholemount images and insets. (b) Quantification of the average diameter of optic nerve cross-section taken halfway between the optic nerve chiasm and optic nerve head in either control or Kif5a knockout (KO) animals (control n = 5, KO n = 5). Two-sample, two-tailed t-test, p = 0.001. (c) Quantification of Brn3a + cell density across entire wholemount retinal surface. Each point represents one retina. The graphs, from left to right, show pairwise comparisons between heterozygous Kif5a KO at 1 month after viral injection (control n = 8, KO n = 8), homozygous Kif5a KO at 1 month after viral injection (control n = 7, KO n = 6), homozygous Kif5a KO at 4 months after viral injection (control n = 5, KO n = 4), and a comparison of the three previous experiments normalized to their control population. C1-C3 are two-sample, two-tailed t-tests, p = 0.003, p = 0.008, and p < 0.0001, respectively. C4 is a one-way ANOVA with post hoc Sidak correction. Between the blue and red columns, p = 0.034. Between red and gold columns, p < 0.0001. The bar heights represent the mean, and the error bars represent the 95% confidence interval. (d) Pattern electroretinogram quantification from mice 6 months after Kif5a KO or control. On the left, the amplitude difference between the P50 peak and the N95 trough was quantified and compared with a two-sample, two-sided t-test (n = 3), p < 0.0001. The bar heights represent the mean, and the error bars represent the 95% confidence interval. On the right, the average traces of each condition are bold, with lighter shades ± SEM.


