. 2022 Mar 24;11:e72443. doi: 10.7554/eLife.72443

Figure 1. The response of dWAT to EGFR inhibition.

(A) Representative images of the rat rash model. (B–D) H&E (B), Oil Red (C), and Caveolin-1 (D) staining of skin from control and Afa-treated rats. Scale bars: 200 μm, 500 μm and 130 μm (top to bottom). p.c. refers to panniculus carnosus. (E and F) Quantification of the dWAT size (E), and adipocyte number (F) in rats with different rash grades compared with the control (Ctrl). n = 3–5 per group. (G) Relationship between dWAT thickness and rash grade. The square values of the Pearson’s correlation coefficients are shown. (H) RT-PCR measurements of mRNA levels of adipogenic genes in skin tissues from control and Afa-treated rats. n = 4–5 per group. Data are presented as the means ± SEM. *p < 0.05, **p < 0.01, and ***p < 0.001 using two-tailed unpaired Student’s t test.

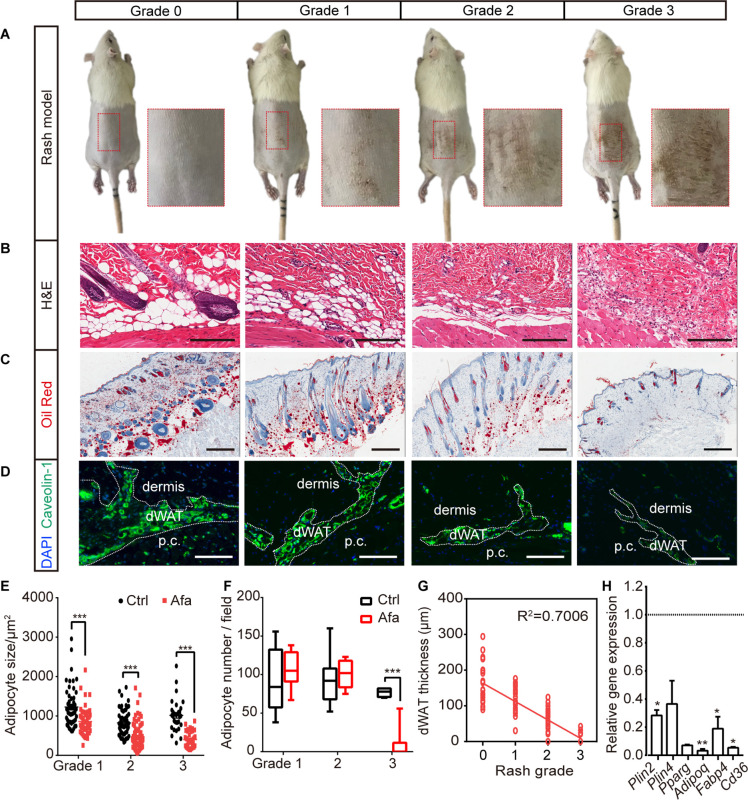
Figure 1.

Figure 1—figure supplement 1. Characteristics of rat rash model.

Figure 1—figure supplement 1.

(A) Body weight change of control and Afa-treated rats. n = 8 per group. (B) Food intake per rat of different Afa dosage. (C) Percentages of different rash grade during Afa treatment. n = 39. (D) Representative photos of rat rash model induced by Erlotinib, Gefitinib, and Osimertinib. (E) CD11b, CD3 (T cell), CD68 (macrophage), and toluidine blue (TB, mastocyte) staining of skin from control and Afa-treated rats at Day 10. Scale bar: 100 μm. (F) Quantitative analysis of toluidine blue staining. The mastocytes were counted in 200 × fields (degranulated defined as eight or more granuli). (G) RT-PCR measurements of mRNA levels of inflammatory genes in skin tissues from Ctrl and Afa-treated rats. n = 5 per group. (H) Schematic of the strategy used to sacrifice rats at different rash grade. Data are presented as the means ± SEM. *p < 0.05, **p < 0.01, and ***p < 0.001 using two-tailed unpaired Student’s t test.
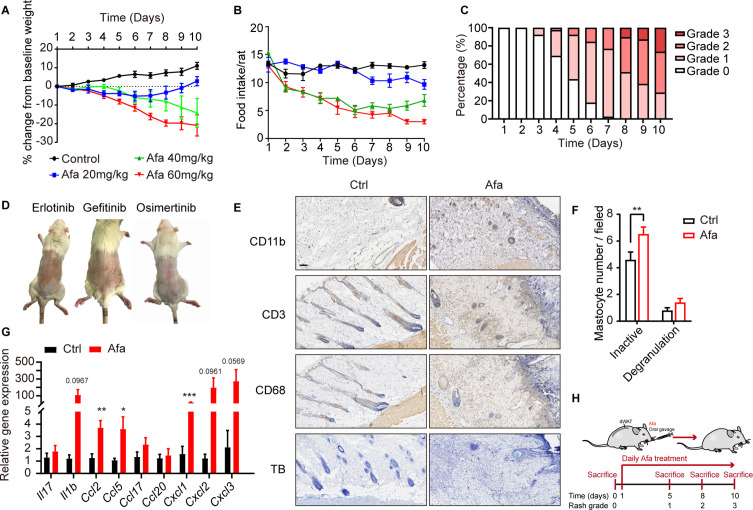
Figure 1—figure supplement 2. Shaving effects rash occurrence and progress.

Figure 1—figure supplement 2.

The back hair on the left back side was shaved while the right side was unshaved at the beginning of Afa treatment, rats were sacrificed according to the rash process of the shaved area. After scarification, right side was shaved to observe the skin phenotype. (A) Representative images of rats before and after shaving and the zoom pictures for rash site. (B) Rash grade for shaved and unshaved area. (C) dWAT thickness. (D) H&E, Oil Red, and Caveolin-1 staining of skin from shaved and unshaved area. Scale bars: 100 μm. Data are presented as the means ± SEM. *p < 0.05, **p < 0.01, and ***p < 0.001 using two-tailed unpaired Student’s t test.
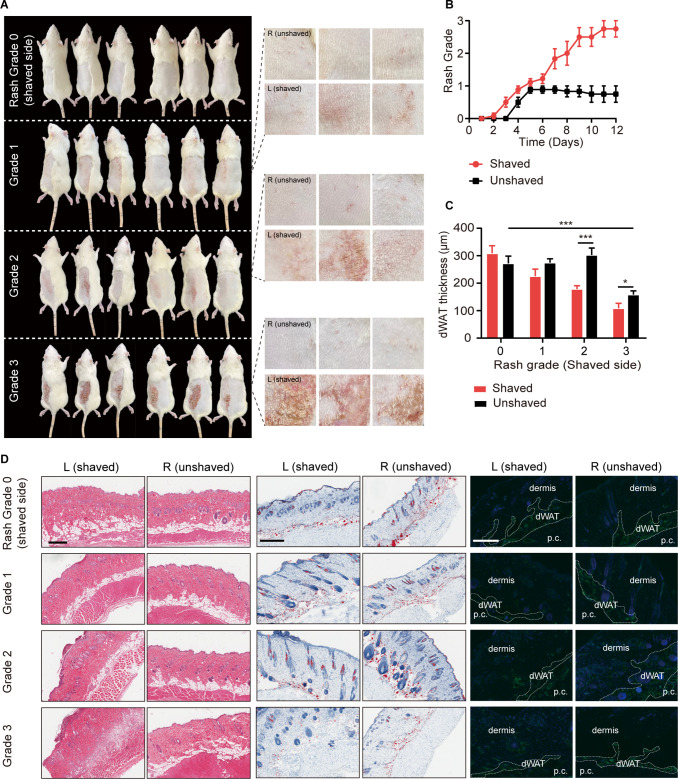
Figure 1—figure supplement 3. Characteristics of sWAT during EGFR inhibition.

Figure 1—figure supplement 3.

(A) Percentage of BW change of sWAT, iWAT and BAT. sWAT was obtained under the same shaved-skin area. n = 3–5 per group. (B) H&E staining of subcutaneous white adipose tissue from Ctrl and Afa-treated rats at indicated time. Scale bars: 300 μm. (C and D) Quantification of the sWAT size (C) and number (D). Data are presented as the means ± SEM. *p < 0.05, **p < 0.01, ***p < 0.001 (Ctrl vs Afa) using two-tailed unpaired Student’s t test.
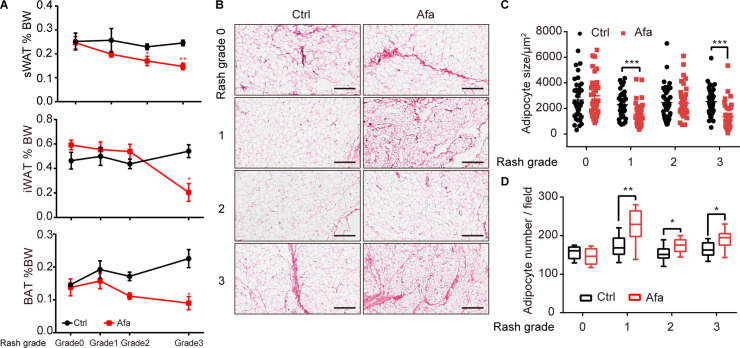
Figure 1—figure supplement 4. Reduced expression of PPARγ and Perilinpin-2 after Afa treatment.

Figure 1—figure supplement 4.

(A) PPARγ and Perilinpin-2 staining of skin from Ctrl and Afa-treated rats at day 10. Scale bar: 100 μm. (B) Quantification of positive signal intensity. Data are presented as the means ± SEM. **p < 0.01, and ***p < 0.001 using two-tailed unpaired Student’s t test.