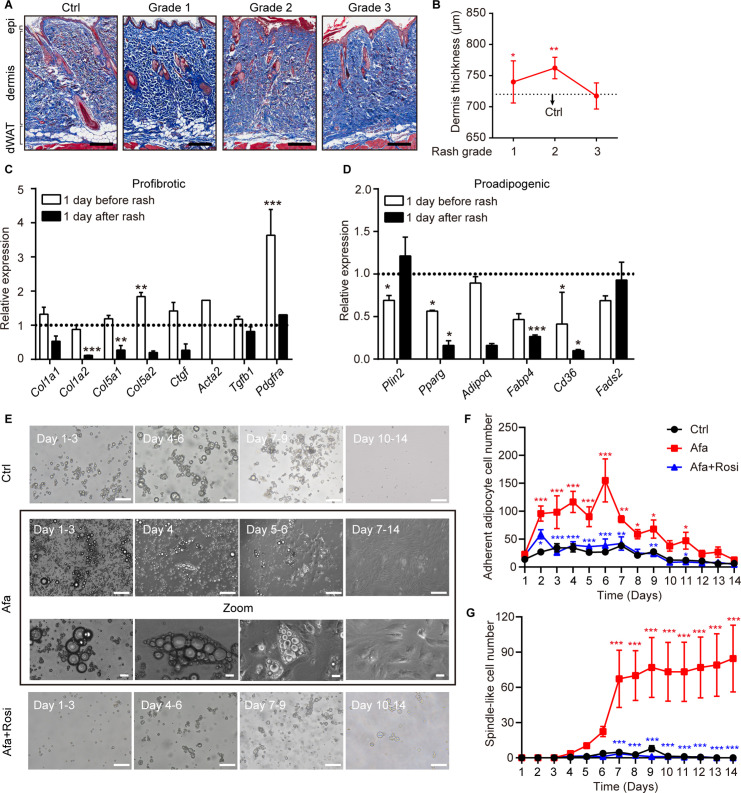
Figure 2. Dedifferentiation of mature dermal adipocytes upon EGFR inhibition.
(A) Masson’s trichrome staining of skin sections from rats at the indicated times. n = 3–5 per group. epi refers to epidermis. Scale bars: 500 μm. (B) Changes in the thickness of the dermis in Ctrl- and Afa-treated rats. n = 3–5 per group. (C and D) RT-PCR measurements of profibrotic genes (C), and proadipogenic genes (D) in isolated dermal adipocytes at the indicated times, n = 3–4 per group. Data was normalized to Ctrl. Dotted line represented the mean gene expression of the Ctrl group. (E) Morphological changes at different time points of Afa (100 nM) or Rosi (5 μM) treatment revealed a transition from mature dermal adipocytes to dedifferentiated adipocytes. Scale bars: 100 μm and 50 μm for zoom pictures. (F) Quantification of adherent adipocyte cells. (G) Quantification of dedifferentiated, spindle-like cells per field. Data are presented as the means ± SEM (Afa/Rosi group vs Ctrl group and Afa +Rosi group vs Afa group). *p < 0.05, **p < 0.01, ***p < 0.001 using two-tailed unpaired Student’s t test and one-way ANOVA.


