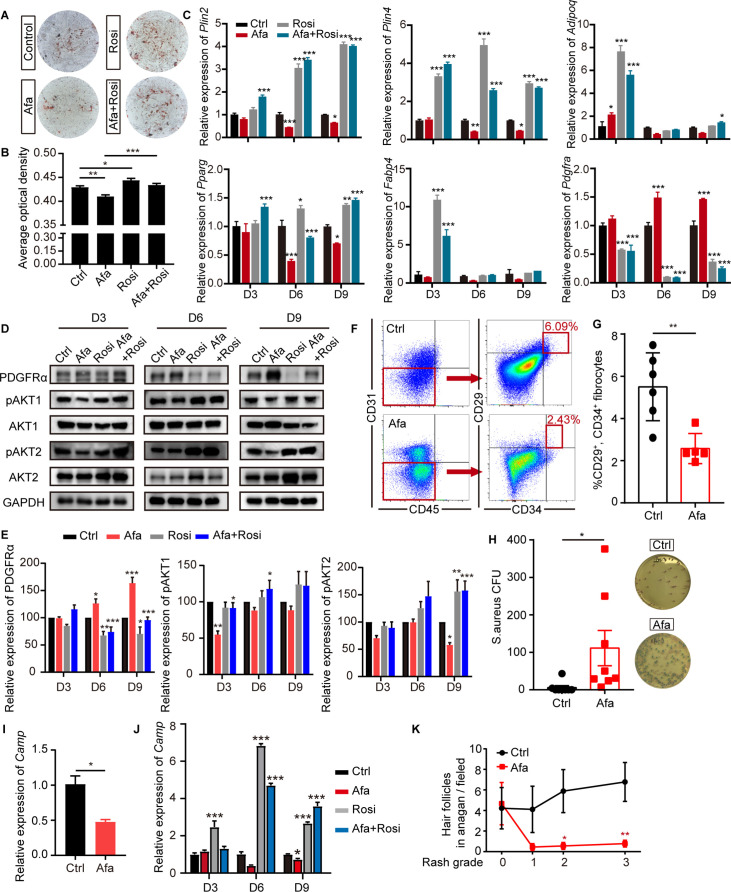
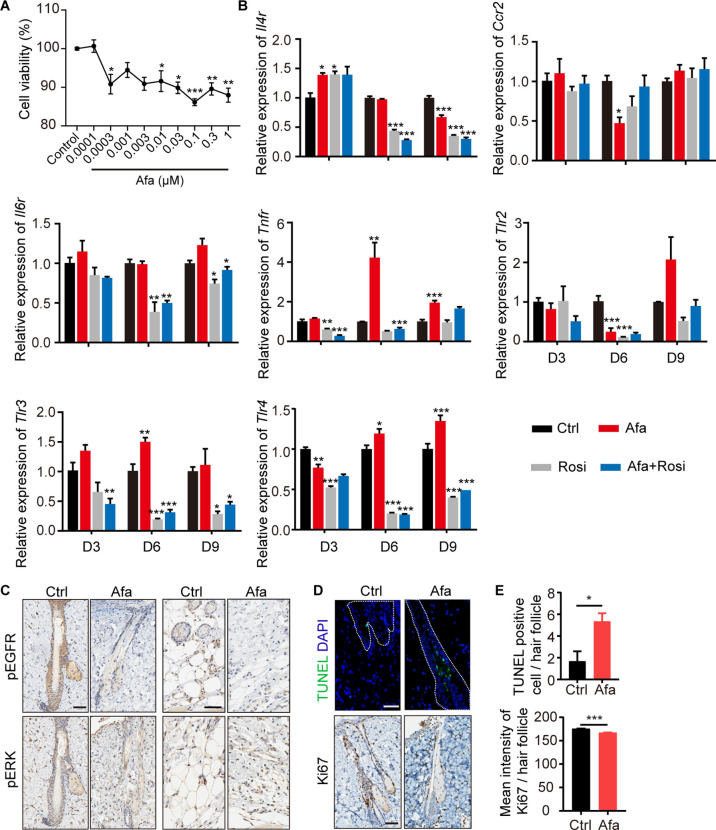
Figure 3. EGFR inhibition blocks adipocyte progenitor differentiation.
(A) dFB cells were isolated from P1 rat skin and then cultured with adipocyte differentiation medium for 9 days in the presence or absence of Afa (10 nM) or Rosi (5 μM). Lipid production was detected using Oil Red staining. (B) Quantification of Oil Red staining. (C) Relative mRNA expression of adipogenic genes at the indicated time points during differentiation. n = 3 per group. (D) Western blot analysis of differentiating dFB cells. (E) Quantification of expression level of PDGFRα, pAKT1 and pAKT2 relative to Ctrl. (F) FACS analysis of adipocyte progenitors in dFB from Ctrl- and Afa-treated rats. (G) The percentage of CD31-, CD45-, CD34+, and CD29+ fibrocytes was quantified. n = 5–6 per group. (H) S. aureus growth in media containing skin homogenates from Ctrl- or Afa-treated rats. n = 8 per group. (I) Relative mRNA expression of Camp from isolated-dWAT at Day 3. n = 5 per group. (J) Relative mRNA expression of Camp at the indicated time points during dFB differentiation. n = 5 per group. (K) Numbers of hair follicles in anagen phase during Afa treatment. n = 3 per group. Data are presented as the means ± SEM. *p < 0.05, **p < 0.01, and ***p < 0.001 (Afa/Rosi group vs Ctrl group and Afa +Rosi group vs Afa group) using two-tailed unpaired Student’s t test and one-way ANOVA.


