. 2022 Mar 24;11:e72443. doi: 10.7554/eLife.72443

Figure 5. HFD-induced dWAT expansion ameliorates rash phenotypes.

(A) Schematic of the strategy used to expand dWAT by the short-term administration of a HFD. (B) H&E staining of skin from normal diet- and HFD-fed rats. Scale bars: 600 μm. (C) Size and thickness of dermal adipocytes. (D) Percentage of sWAT, gWAT and BAT relative to BW. (E) Body weight change. (F) Western blot analysis and quantifications of isolated-dWAT cells. n = 3–5 per group. (G) Relative mRNA expression of adipogenic genes of isolated-dWAT cells. n = 5 per group. (H) Photos of the rash at 44 days. (I) Changes in the rash grade after Afa treatment. (J) H&E, Oil Red and Caveolin-1 staining of skin biopsies from Ctrl and HFD rats. Scale bars: 300, 500 and 130 μm (top to bottom). Data are presented as the means ± SEM. *p < 0.05, **p < 0.01, and ***p < 0.001 (HFD group vs Ctrl group) using two-tailed unpaired Student’s t test.

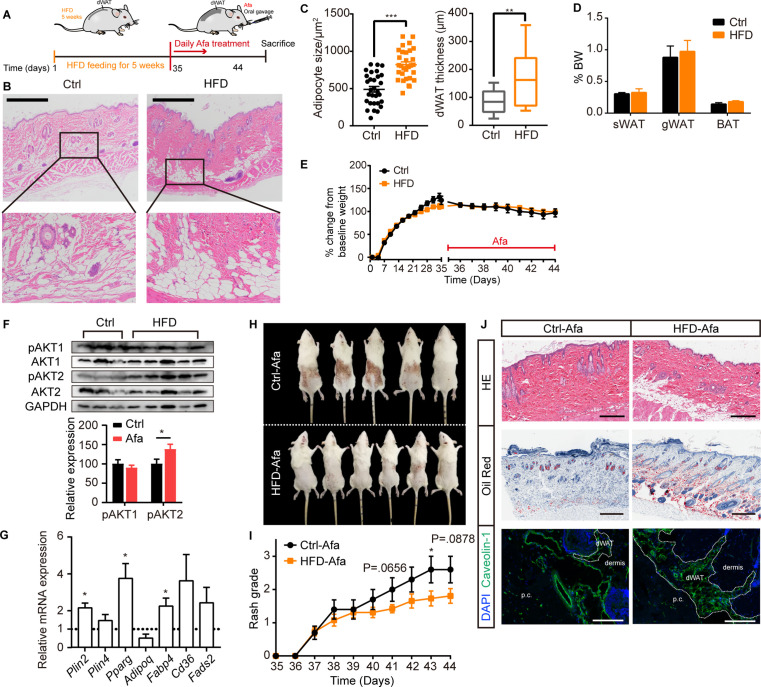
Figure 5—source data 1. Original western blot data for Figure 5F.

Figure 5.

Figure 5—figure supplement 1. Additional characterization of HFD rats.

Figure 5—figure supplement 1.

(A) Serum lipids of Ctrl and HFD rats. APO-B refers to apolipoprotein B, HDL-C refers to high-density lipoproteincholesterol, LDL-C refers to low-density lipoproteincholesterol, TC refers to total cholesterol, TG refers to triglyceride. n = 3 per group. (B) Left and right photos of rash from Ctrl and HFD rats. (C) CD11b, CD3 (T cell), CD68 (macrophage), and toluidine blue (TB, mastocyte) staining of skin biopsies from Ctrl-Afa and HFD-Afa rats at day 44. Scale bar: 200 μm. (D) Relative expression of inflammatory receptors in dFB assayed by RT-PCR from rats at day 35 and day 44. n = 5 per group. (E) IL6, TNFα, CCL2 staining of skin biopsies from Ctrl-Afa and HFD-Afa rats at day 44. Scale bar: 200 μm. Data are presented as the means ± SEM. *p < 0.05 using two-tailed unpaired Student’s t test.
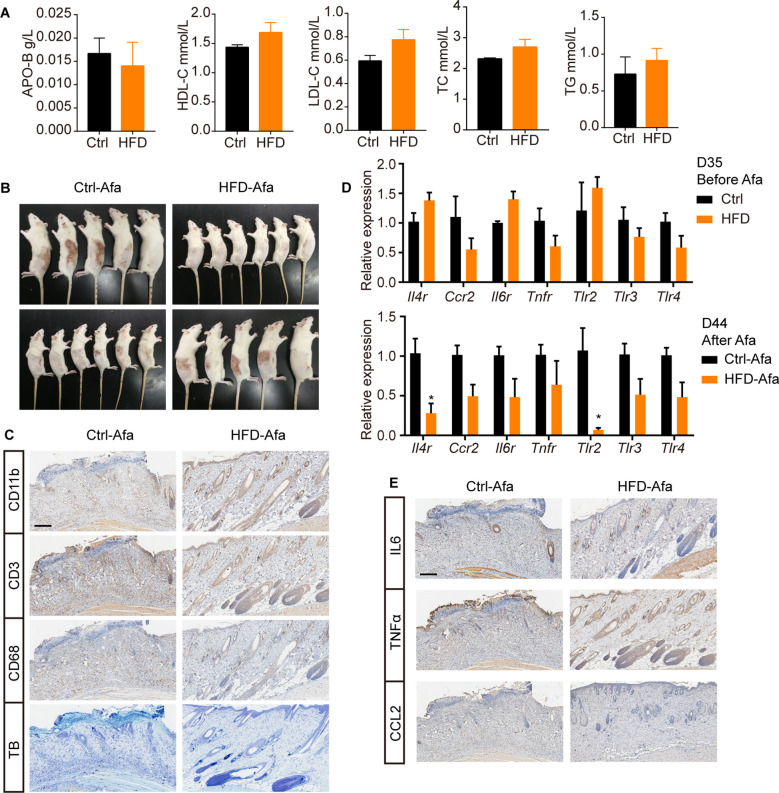
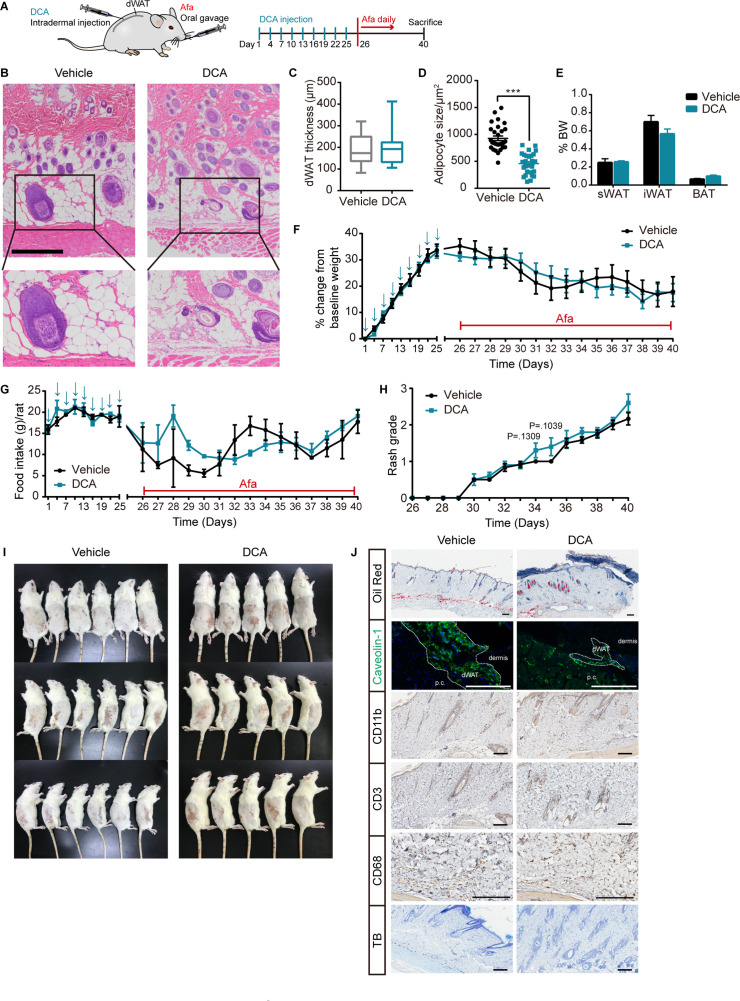
Figure 5—figure supplement 2. DCA-induced dWAT ablation aggravates rash phenotypes.

Figure 5—figure supplement 2.

(A) Schematic of the strategy to ablate dWAT by repeatedly DCA intradermal injection. (B) H&E staining of skin from Vehicle and DCA rats. Scale bars: 300 μm. (C and D) Size (C) and thickness (D) of dermal adipocytes. (E) Percentage of BW of sWAT, gWAT and BAT. (F) Body weight. (G) Food intake. (H) Rash grade. (I) Photos of rash at 40 days. (J) Oil Red, Caveolin-1, CD11b, CD3 (T cell), CD68 (macrophage), and toluidine blue (TB, mastocyte) staining of skin biopsies from Ctrl and DCA rats at day 40. Scale bars: 200 μm. Data are presented as the means ± SEM. ***p < 0.001 using two-tailed unpaired Student’s t test.