
Figure 4. The antiobesity effect of sulforaphane (SFN) is NRF2-dependent and HDAC6-independent.
(A–H) NRF2 KO mice were placed on high-fat diet (HFD) to induce obesity. Mice were then treated daily by i.p. vehicle or SFN injections. SFN dose was 5 mg/kg for the first three weeks and increased to 10 mg/kg thereafter. Wild-type diet-induced obese (DIO) mice were treated with vehicle or SFN for the same period for comparison. (A, B) Body weight (A) and percent change in body weight (B) of the NRF2 KO mice throughout the vehicle or SFN treatments. (C) Body weight of NRF2 KO (the same cohort graphed in A) and wild-type DIO mice receiving treatments with vehicle or SFN for the same period for comparison. (D) Percent change in body weight of NRF2 KO and wild-type DIO mice at the end of the treatments shown in panel (C). (E, F) Daily food intake (E) and cumulative food intake (F) of the DIO NRF2 KO mice (n = 6 per group) during the treatment period. (G, H) Glucose tolerance test (GTT) (G) and the area under the curve (AUC) of the GTT (H) performed on NRF2 KO DIO mice (n = 6, 8) during the 3 weeks of vehicle or 5 mg/kg SFN treatment shown in (A). (I–K) HDAC6 KO or wild-type mice were fed HFD to induce obesity. The mice were then treated with vehicle or 5 mg/kg SFN by daily i.p. injections. Body weights (I), percent change in body weight (J), and daily food intakes (K) were recorded (n = 4–6 mice per group). *p<0.05, **p<0.01, ***p<0.001 by two-way ANOVA with Sidak correction (A–I).

Figure 4—figure supplement 1. Effect of sulforaphane (SFN) on tubulin acetylation in mouse embryonic fibroblasts (MEFs).
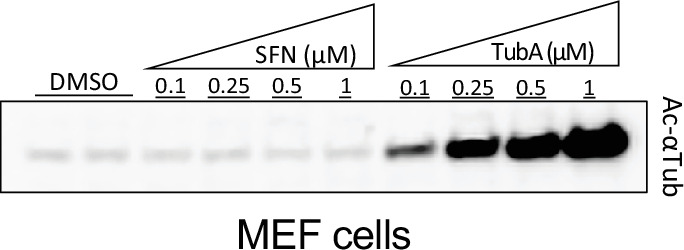
Figure 4—figure supplement 2. Sulforaphane (SFN) does not induce a beige or brown adipose-specific gene expression profile.
