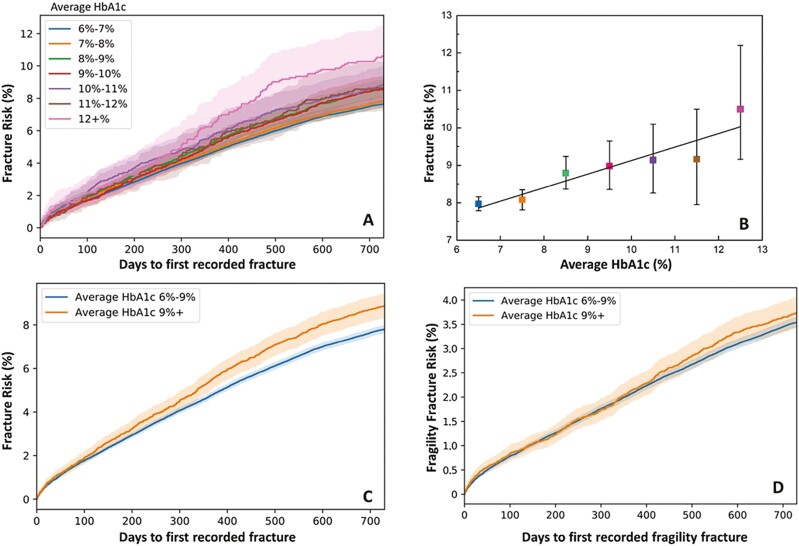
Figure 2.
(A) Kaplan-Meier estimation of unadjusted fracture risk with 95% CI stratified by 1% difference of HbA1c groups for 730 days of additional follow-up period. (B) The “cross-section” of unadjusted fracture risk at the end of 2-year follow-up period shows a significant increasing linear correlation with the increase of longitudinal HbA1c percentage (P = 0.003, R = 0.93). (C) Kaplan-Meier estimation of unadjusted all fracture risk when longitudinal glycemic control is separated into 2 groups: adequate glycemic control (N = 142 600) and poor glycemic control (N = 14 839). (D) Kaplan-Meier estimation of unadjusted fragility fracture risk in poor and adequate glycemic control. The difference in fragility fracture risk between groups is not statistically significant (P = 0.23).

