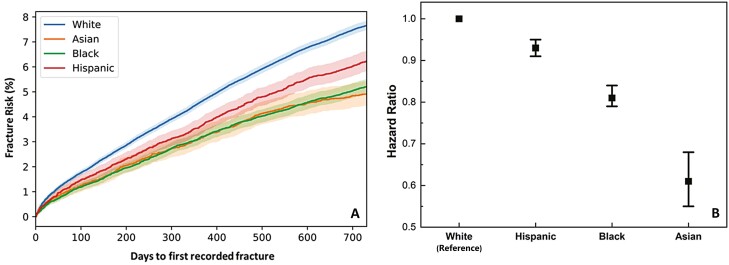
Figure 4.
(A) Unadjusted fracture risk estimation stratified by 4 racial groups (White population: N = 99 056; Asian population: N = 8195; Black population: N = 25 647, Hispanic population: N = 14 888; Other/nonspecified not considered). (B) Using White population as a reference point (hazard ratio set to 1), the hazard ratios for other racial groups with covariates adjustment. Hazard ratio for Hispanic population: 0.93 (CI 0.91-0.95); for Black population: 0.81 (CI 0.79-0.84); for Asian population: 0.61 (CI 0.55-0.68). All groups are significantly different from each other.

