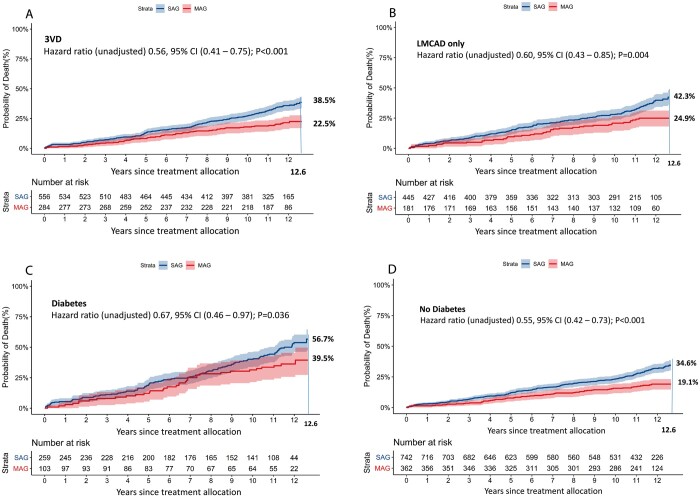
Figure 3:
(A–D) These graphs present the cumulative mortality in SAG and MAG patients in specific clinically important subgroups. (A) 3VD, (B) LMCAD, (C) preoperative diabetes mellitus and (D) no preoperative diabetes mellitus. 3VD: three-vessel disease; CI: confidence interval; LMCAD: left main coronary artery disease; MAG: multiple arterial grafts; SAG: single arterial graft. The axis label ‘years since treatment allocation’ indicates a follow-up period starting from the day of randomization or allocation to percutaneous coronary intervention-ineligible coronary artery bypass grafting registry, which does not necessarily correlate to the operative day.

