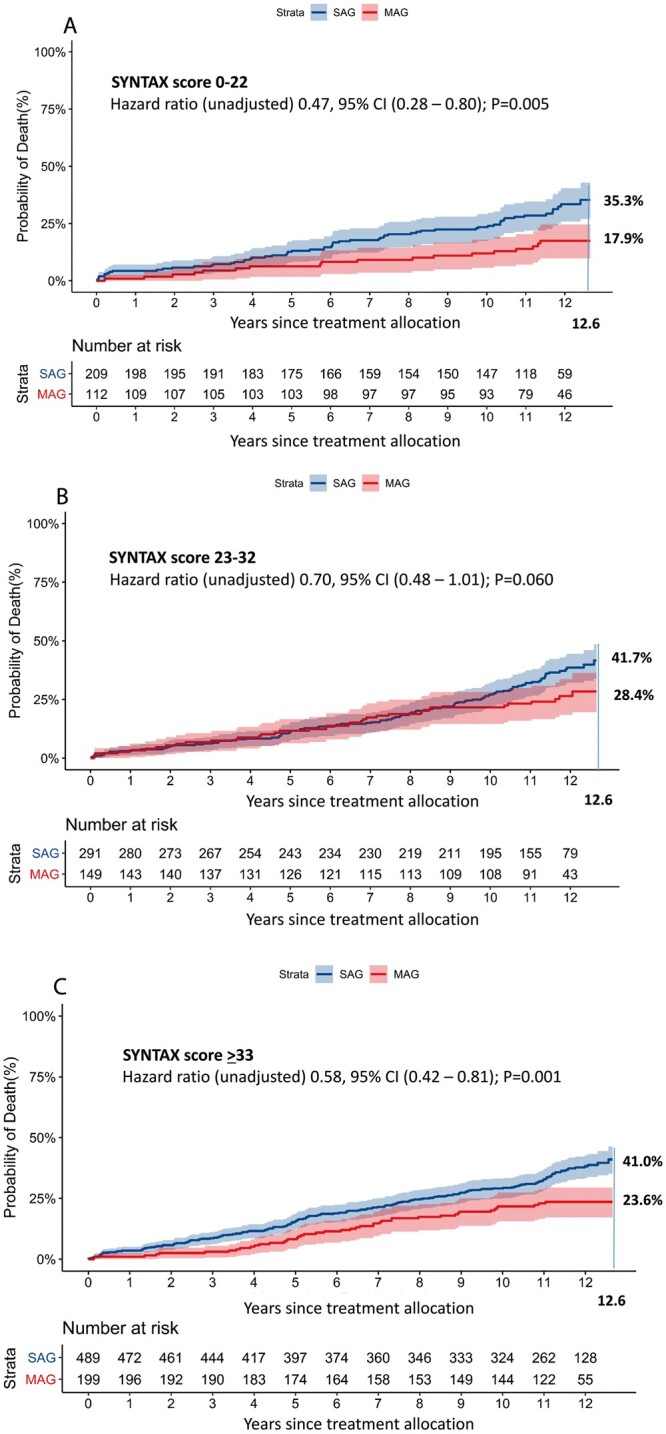
Figure 4:

(A–C) This graph presents the cumulative mortality in the MAG and SAG groups stratified by their preoperative SYNTAX score. CI: confidence interval; MAG: multiple arterial grafts; SAG: single arterial graft. The axis label ‘years since treatment allocation’ indicates a follow-up period starting from the day of randomization or allocation to percutaneous coronary intervention-ineligible coronary artery bypass grafting registry, which does not necessarily correlate to the operative day.
