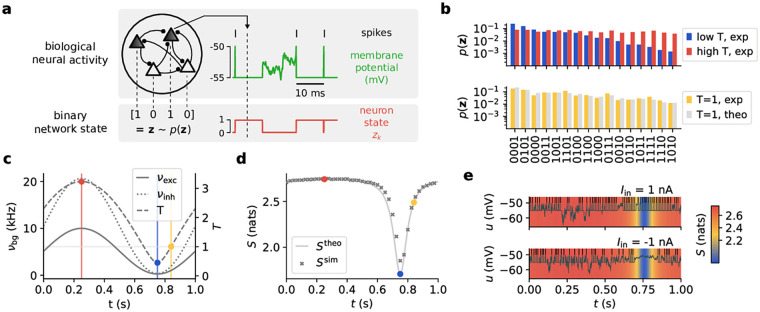
Fig 2. Effects of oscillatory background activity on sampled distributions.
(a) Network dynamics. Each neuron encodes a binary random variable according to its refractoriness. When the membrane potential (green) is clamped to the reset value, the neuron state (red) is considered to be z = 1 (z = 0 otherwise). The collection of the resulting network states z forms an estimate for the implemented probability distribution p(z). (b) Distributions sampled by a 4-neuron network at the three temperatures marked in (c). States are ordered according to their respective probabilities at the low temperature to emphasize the effect of tempering visually. (c) Time course of excitatory and inhibitory background rates (dashed and dotted lines, Eq 10), along with the associated temperature (solid line, Eq 4). Note that νexc is scaled by 0.5 and wexc by the square root of the inverse scaling factor to demonstrate that balance is independent of such a rescaling. (d) Simulated (crosses) vs. calculated (solid line) entropy course S(t). The slight lag is due to the finite relaxation time constants τs, τref of the network (Eq 35 only holds strictly for quasi-static temperature changes). (e) Effect of tempering on individual membrane potentials and spiking activity. The background color represents the corresponding entropy.

