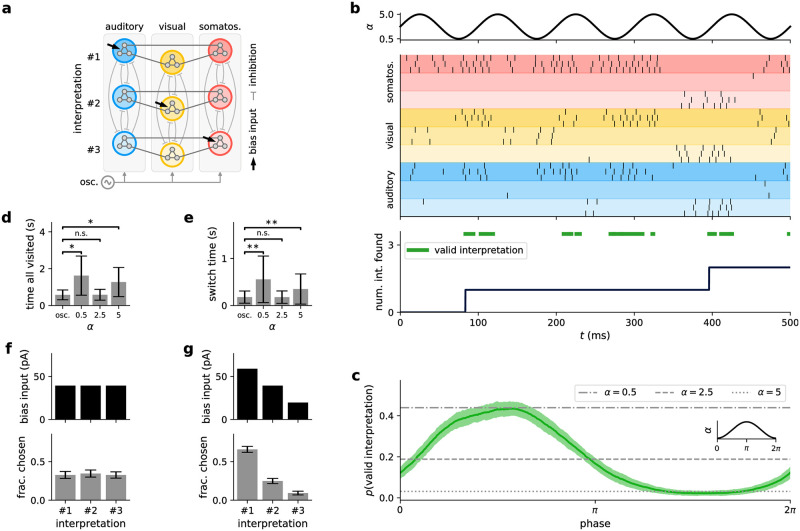
Fig 6. Background oscillations structure computations into sampling episodes in conductance-based networks.
(a) Setup of stimulus disambiguation task. Assemblies (large colored circles) encode interpretation of stimulus spanning three different sensory modalities (auditory, visual, somatosensory). For each modality, every interpretation is encoded by the activity of a single assembly (different interpretations are represented by different color hues), with lateral inhibition ensuring that one interpretation is chosen. One assembly per sensory modality receives a bias input, resulting in ambiguous input. Simultaneous activity of connected assemblies encoding the same interpretation across all modalities encodes selection of an interpretation (i.e., a solution). All neurons receive oscillatory background input. (b) Network activity with oscillating background input. Top: background activity scaling by α. Middle: spike raster plot of network activity (color coding of assemblies as in panel a). Bottom: number of solutions (i.e., interpretations) visited so far. Green bars show times in which the network state encodes a solution. (c) Probability of network state encoding a solution depending on the phase of the oscillating background input. Gray lines show solution probabilities in networks without oscillating background activity for different activity levels α ∈ {0.5, 2.5, 5}. Inset shows background activity phase for reference. (d) Mean time until the network has visited all three solutions for oscillating and constant background activity (over N = 100 runs for each case). Bars and whiskers show mean and standard deviation, respectively. Significance was calculated with Wilcoxon rank-sum test with and . (e) Time between choosing distinct solutions (see Section Methods for details). Plot as in panel d with . (f) For constant bias inputs (top, cf. panel a), solutions are chosen equally often (bottom, means and standard deviations). (g) For different bias inputs (top), the probability of choosing the corresponding solution matches the input values (bottom). Plot as in panel f.

