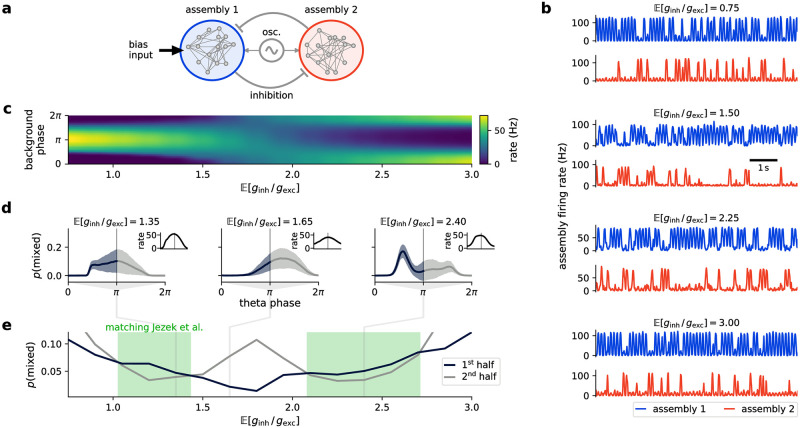
Fig 7. Relating model features to experimental data.
(a) Simple network model reproducing place-cell flickering behavior. The model consists of two assemblies of spiking neurons with recurrent excitation and lateral inhibition. Assemblies 1 (blue) and 2 (red) encode the correct and incorrect interpretation of the spatial context, respectively. Neurons in assembly 1 receive a bias input current, and all neurons receive oscillatory background input. (b) Example model activity (cf. Fig 3c in [44]). Assembly firing rates encoding correct and incorrect interpretations of context are shown in blue and red, respectively. The model behavior holds as the ratio of the mean inhibitory to excitatory background conductance is varied (plot shows ). (c) As changes, the minimum firing rate shifts along the background input phase. The background input cycles are defined here as having their onset time (phase zero) when the input rate is at its minimum, i.e., the maximum input occurs at phase π. (d) Probability of mixed interpretations during a cycle. Solid line shows mean, shaded area standard deviation over N = 100 network runs of 50 s each. Insets show background input (left) and network firing rate (right, cf. panel b). To match [44], the phase is reordered for every value of , so that phase zero is aligned with the minimum firing rate in the network (see right inset). (e) Mixed state probability in the first and second half of network activity cycle as the mean background conductance ratio is varied. Green shading shows areas in which the mixed probability is larger in the first half of the cycle, matching the results of [44].

