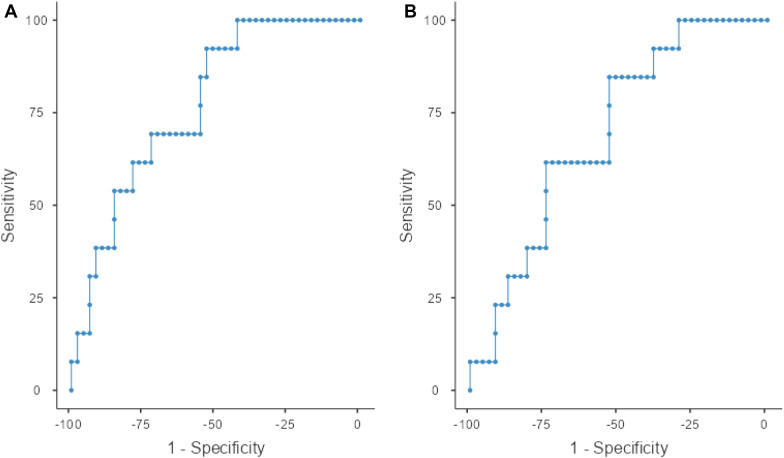
Fig. 5.
ROC curves of the morphological variables of B4c referring to mean ICP greater than 20 mm Hg. a Curve referring to P2/P1 ratio B4c (AUC: 0.786). b Curve referring to TTP B4c (AUC:0.694). AUC area under the curve, B4c Brain4care monitor, ICP intracranial pressure, ROC receiver operating characteristic, TTP time-to-peak

