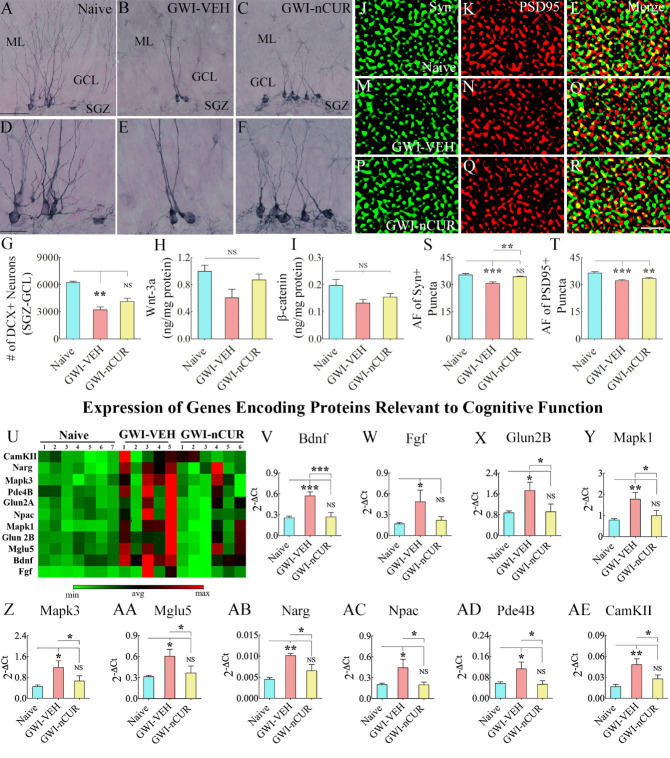
Figure 13.
Twelve weeks of nCUR treatment in rats with chronic GWI enhanced neurogenesis, reduced synapse loss, and stabilized expression of genes involved in altered cognitive function in the hippocampus. Figures A-F illustrate examples of doublecortin-positive (DCX+) newly born neurons from naïve control (A), GWI-VEH (B), GWI-nCUR (C) groups. D, E, and F are magnified views of regions from A, B, and C. The bar chart G compares the number of DCX+ neurons between different groups. Neurogenesis was decreased in the GWI-VEH group but significantly increased in the GWI-nCUR group. GCL, granule cell layer; ML, molecular layer; SGZ, subgranular zone. Scale bar, A-C = 50 μm; D-F = 25 μm. The bar charts H and I compare Wnt-3a (H) and beta-catenin (I) concentration between different groups. Figures J-R shows examples of synaptophysin+ (Syn+) and postsynaptic density 95+ (PSD95+) puncta in the dentate molecular layer from naïve control (J-L), GWI-VEH (M-O), GWI-nCUR (P-R) groups. The bar charts S-T compare area fraction (AF) of Syn+ and PSD95+ puncta in the dentate molecular layer between different groups. Both Syn+ and PSD95+ puncta were reduced in the GWI-VEH group, and Syn+ puncta were normalized to the naïve control level in the GWI-nCUR group. Scale bar, J-R = 1 μm. Figure U compares the relative expression of various genes involved in altered cognitive function between different groups. The bar charts in V-AE compare the expression of Bdnf (V), Fgf (W), Glun2B (X), MapK1 (Y), MapK3 (Z), Mglu5 (AA), Narg (AB), Npac (AC), Pde4B (AD), and CamKII (AE) between different groups. All genes exhibited increased expression in the GWI-VEH group but were normalized to the naïve control level in the GWI-nCUR group. *, p<0.05, **, p<0.01, and ***, p<0.001; NS, not significant. DH, dentate hilus; GCL, granule cell layer; ML, molecular layer; SGZ, subgranular zone.

