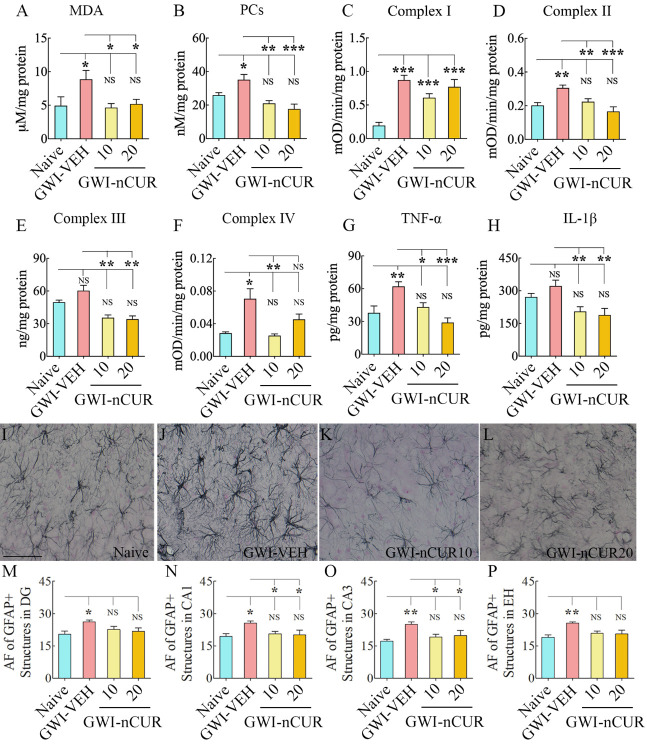
Figure 3.
Eight weeks of nCUR treatment, commencing 2 months after exposure to GWI-related chemicals and stress, reduced oxidative stress, mitochondrial dysfunction, and inflammation in the hippocampus. The bar charts in the top two rows compare the concentrations of malondialdehyde (MDA; A), protein carbonyls (PCs; B), mitochondrial complexes I (C), II (D), III (E), and IV (F), tumor necrosis factor-alpha (TNF-α; G), and interleukin-1 beta (IL-1β; H) between naïve rats and GWI rats receiving vehicle (GWI-VEH) or different doses of nCUR (GWI-nCUR10, GWI-nCUR20). Compared to the naïve control group, nCUR treatment at both doses normalized the MDA and PCs (A-B), mitochondrial complexes II and IV (D, F), and TNF-α (G) to naïve control levels. Compared to the GWI-VEH group, the concentration of complex III (E) and IL-1β (H) were also reduced in nCUR groups. (I-L) show examples of GFAP+ astrocytes from the CA3 subfield of naïve control (I), GWI-VEH (J), GWI-nCUR10 (K), and GWI-nCUR20 (L) groups. The bar charts M-P compare the area fraction (AF) of GFAP+ structures in the DG (M), the CA1 subfield (N), the CA3 subfield (O), and the entire hippocampus (P) between different groups. Note that the AF of GFAP+ structures is higher in the GWI-VEH group, but AF’s in all hippocampal regions were normalized to naïve control levels in both nCUR groups. Scale bar, I-L = 100 μm. *, p < 0.05, **, p < 0.01, and ***, p < 0.001; NS, not significant.

