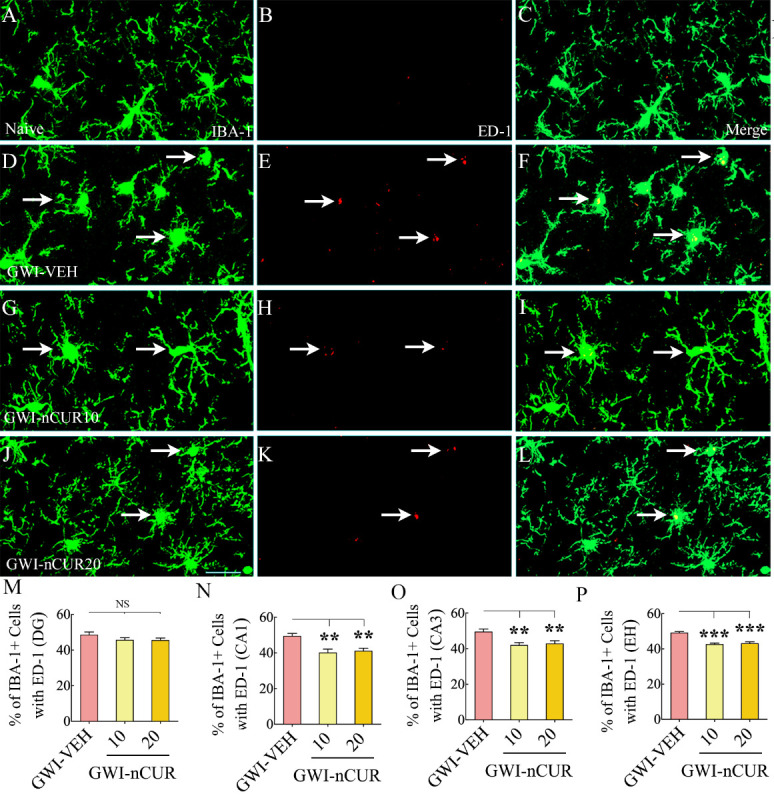
Figure 4.

Eight weeks of nCUR treatment, commencing 2 months after exposure to GWI-related chemicals and stress, reduced activated microglia in the hippocampus. Figures A-L illustrate examples of IBA-1+ microglia expressing ED-1 in the hippocampus of naïve (A-C) and GWI rats receiving vehicle (GWI-VEH; D-F) or different doses of nCUR (GWI-nCUR10, G-I; GWI-nCUR20; J-L). Bar charts M-P illustrate the percentages of IBA-1+ microglia expressing ED-1 in the dentate gyrus (DG; M), CA1 subfield (N), CA3 subfield (O), and entire hippocampus (P). Compared to the GWI-VEH group, both nCUR groups displayed reduced percentages of IBA-1+ microglia expressing ED-1 (i.e., activated microglia) in the CA1 and CA3 subfields of the hippocampus and the entire hippocampus. Scale bar, A-L = 25 μm. **, p<0.01, and ***, p< 0.001; NS, not significant.
