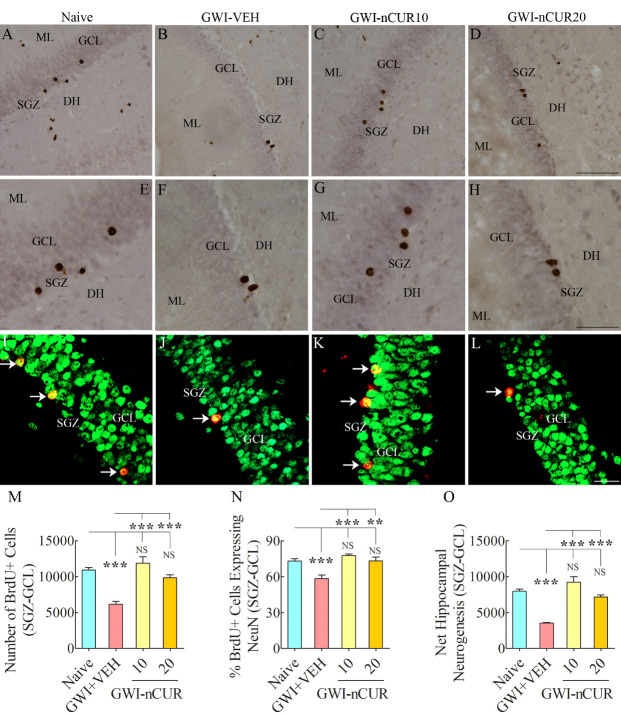
Figure 5.
Five weeks of nCUR treatment, commencing 2 months after exposure to GWI-related chemicals and stress enhanced neurogenesis in the hippocampus. Figures in (A-H) show examples of 5’-bromodeoxyuridine-positive (BrdU+) cells in the SGZ-GCL of the hippocampus from naïve (A) and GWI rats receiving vehicle (GWI-VEH; B) or different doses of nCUR (GWI-nCUR10, C; GWI-nCUR20; D). (E, F, G, and H) are magnified views of regions from A, B, C, and D. Bar chart M compares the number of BrdU+ newly born cells in the SGZ-GCL of the hippocampus between different groups of rats. Note a significantly reduced number of BrdU+ cells in the GWI-VEH group compared to the naive control group. nCUR treatment at both doses enhanced the production of new cells (i.e., BrdU+ cells). Figures in I-L illustrate examples of BrdU+ cells expressing neuron-specific nuclear antigen (NeuN, arrows) from a naive control rat (I), a GWI rat receiving vehicle (J), a GWI rat receiving 10 mg/Kg nCUR (K), and a GWI rat receiving 20 mg/kg nCUR (L). The bar chart in N compares percentages of BrdU+ cells expressing NeuN, whereas the bar chart in (O) compares net hippocampal neurogenesis between different groups. Note significantly reduced percentage of BrdU+ cells expressing NeuN and net hippocampal neurogenesis in the GWI-VEH group compared to the naïve group. nCUR treatment at both doses normalized the neuronal differentiation of BrdU+ cells and net neurogenesis to naïve control levels. **, p < 0.01; ***, p<0.001; NS, not significant. DH, dentate hilus; GCL, granule cell layer; ML, molecular layer; SGZ, subgranular zone. Scale bar, A-D = 100 µm; E-H = 50 µm; I-L = 25 µm.

