
Figure 4.
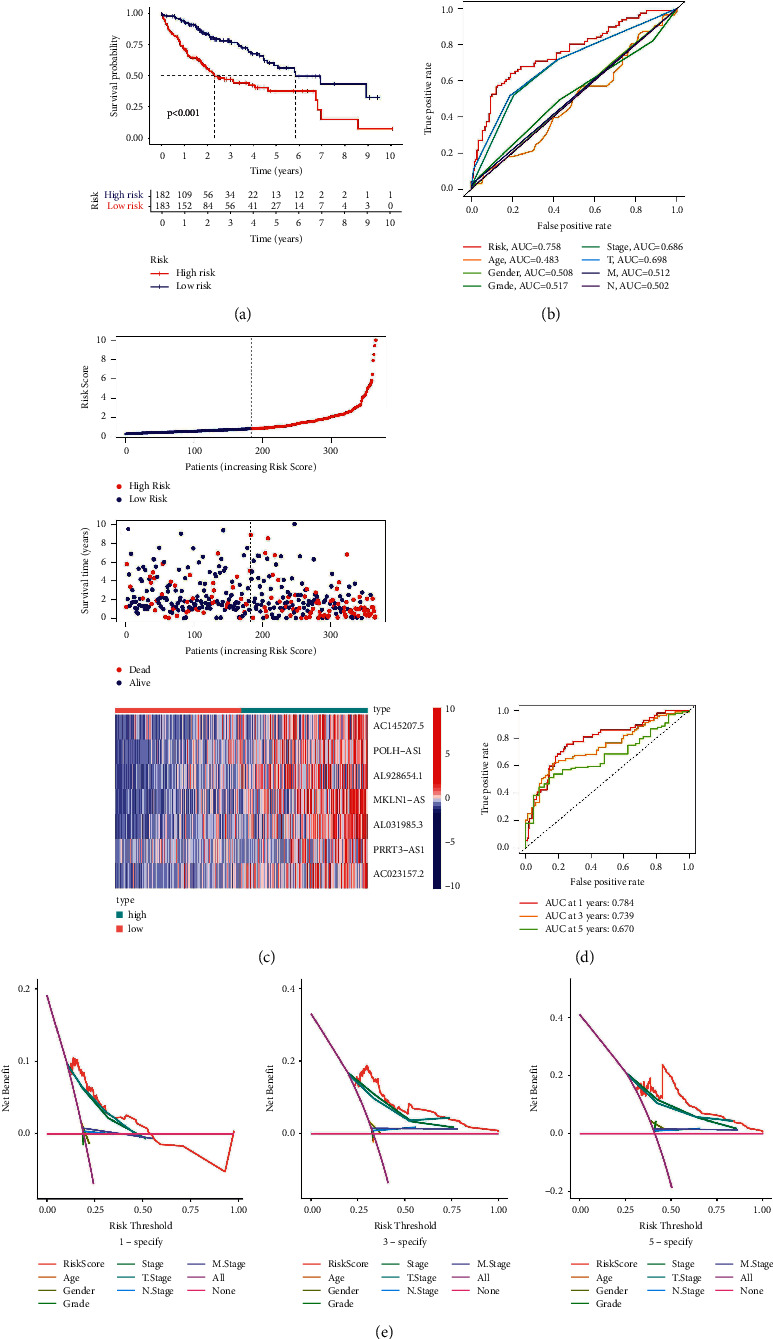
Validation of the seven inflammatory response-related lncRNAs signature. (a) K–M survival analysis result. (b) The AUC values for forecasting overall survival based on risk factors. (c) Survival status and the risk score distribution of HCC patients. (d) The AUC of the ROC curves represented 1-, 3-, and 5-year survival rate of HCC patients. (e) The DCA curves for the signature and clinicopathological manifestation.