Figure 2.

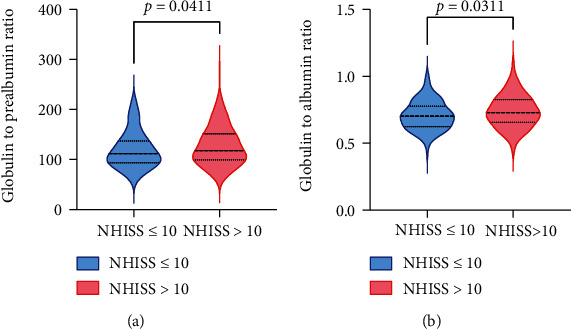
Correlation between GPR (a) and GAR (b) levels and disease severity according to NIHSS scores in AIS patients. Bar represents median with interquartile range.

Correlation between GPR (a) and GAR (b) levels and disease severity according to NIHSS scores in AIS patients. Bar represents median with interquartile range.