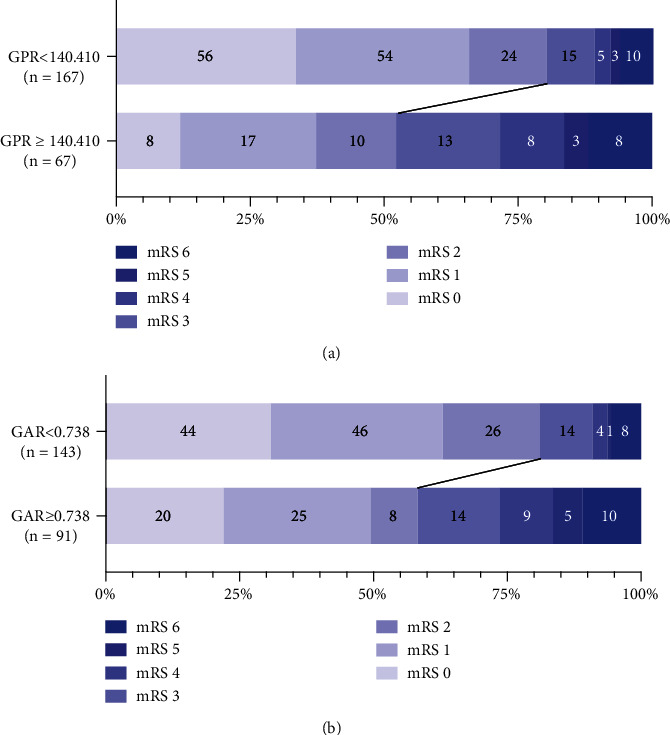
Figure 4.

Distribution of 3-month mRS scores in optimal cut-off value of the globulin to prealbumin ratio (GPR) (a) and the globulin to albumin ratio (GAR) (b). Numbers in bars are absolute numbers.

Distribution of 3-month mRS scores in optimal cut-off value of the globulin to prealbumin ratio (GPR) (a) and the globulin to albumin ratio (GAR) (b). Numbers in bars are absolute numbers.