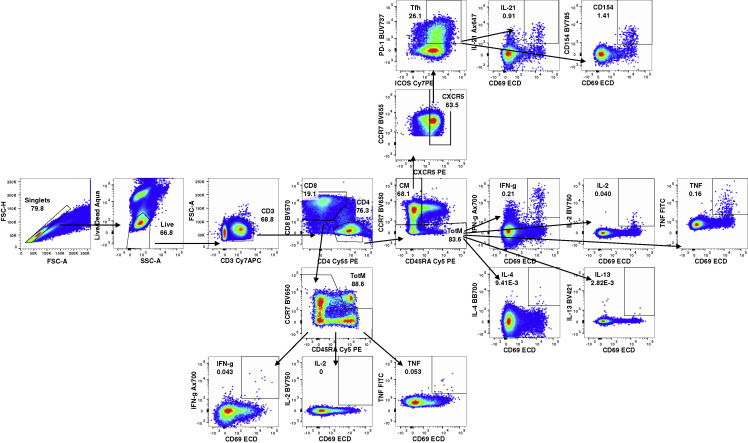
Figure S7.
T cell-gating strategy, related to Figure 4
Representative flow cytometry plots showing gating strategy for T cells in Figures S8 and S9. Cells were gated as singlets and live cells on forward and side scatter and a live/dead aqua blue stain. CD3+ events were gated as CD4+ or CD8+ T cells. Total memory CD8+ T cells were selected based on expression of CCR7 and CD45RA. Finally, SARS-CoV-2 S-specific memory CD8+ T cells were gated according to co-expression of CD69 and IL-2, TNF or IFNγ. The CD4+ events were defined as naive, total memory, or central memory according to expression of CCR7 and CD45RA. CD4+ cells with a TH1 phenotype were defined as memory cells that co-expressed CD69 and IL-2, TNF or IFNγ. CD4+ cells with a TH2 phenotype were defined as memory cells that co-expressed CD69 and IL-4 or IL-13. TFH cells were defined as central memory CD4+ T cells that expressed CXCR5, ICOS, and PD-1. TFH cells were further characterized as IL-21+, CD69+ or CD40L+, CD69+.

