Figure S8.
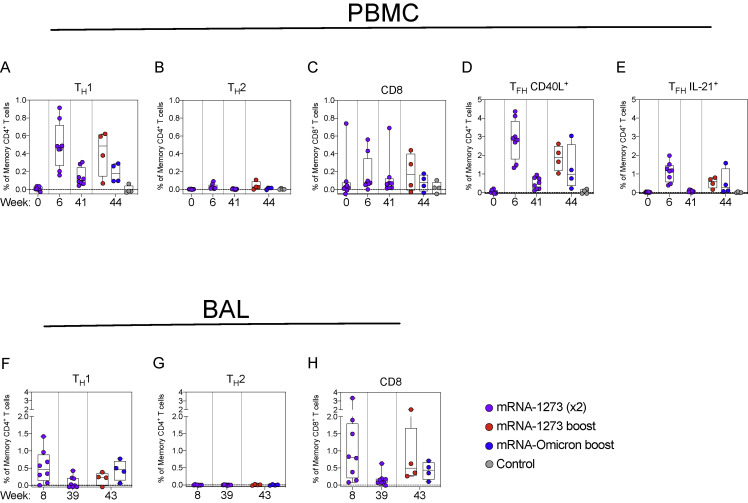
Both mRNA-1273 and mRNA-Omicron boost T cell responses to S peptides, related to Figure 4
(A–E) PBMC collected at weeks 0, 6, 41, and 44 post-immunization. Cells were stimulated with SARS-CoV-2 S1 and S2 peptide pools (WA1) and then measured by intracellular cytokine staining.
(A and B) Percentage of memory CD4+ T cells with (A) TH1 markers (IL-2, TNF, or IFNγ) or (B) TH2 markers (IL-4 or IL-13) following stimulation.
(C) Percentage of CD8+ T cells expressing IL-2, TNF, or IFNγ.
(D and E) Percentage of TFH cells that express (D) CD40L or (E) IL-21.
(F–H) BAL fluid was collected at weeks 8, 39, and 43 post-immunization. Lymphocytes in the BAL were stimulated with S1 and S2 peptide pools (WA1) and responses measured by intracellular cytokine staining using TH1 (F), TH2 (G), and CD8 markers (H). Break in y axis indicates a change in scale without a break in the range depicted.
Circles in (A–H) indicate individual NHP. Boxes represent interquartile range with the median denoted by a horizontal line. Dotted lines set at 0%. Reported percentages may be negative due to background subtraction and may extend below the range of the y axis. 8 vaccinated NHP, split into 2 cohorts postboost. 4 control NHP shown for comparison.

