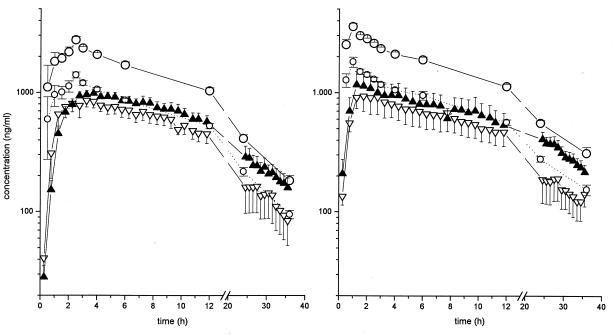
FIG. 1.
Profiles of time versus total-drug (open circles, solid line) and free-drug (open circles, dotted line) concentrations in plasma and interstitial fluid for muscle (solid triangles) and subcutaneous adipose tissue (open triangles) following administration of moxifloxacin (single p.o. dose of 400 mg [left panel] or single i.v. dose of 400 mg over 60 min [right panel]) in healthy volunteers (n = 12). The results are presented as means ± standard errors.

