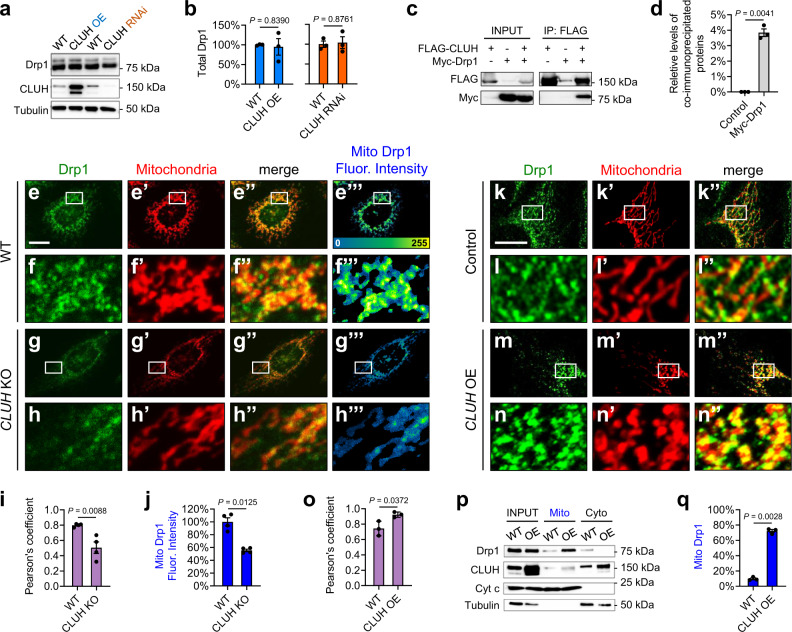
Fig. 6. CLUH promotes the recruitment of Drp1 to mitochondria in mammalian cells.
a, b Western blots showing Drp1 protein levels in response to CLUH overexpression or CLUH RNAi. Drp1 levels were normalized to Tubulin levels (mean ± SEM, n = 3 independent experiments). c, d Co-immunoprecipitation using lysates from HeLa cells transfected with the indicated constructs. The INPUT represents 5% of each total lysate. Myc-Drp1 was co-immunoprecipitated with FLAG-CLUH by using a mouse anti-FLAG antibody. The levels of co-immunoprecipitated proteins were normalized to INPUT levels (mean ± SEM, n = 3 independent experiments). e–h”’ Confocal microscopy images showing levels of mitochondrially bound Drp1 (“Mito Drp1”) in HeLa cells with digitonin treatment. Drp1 and mitochondria are labeled using a mouse anti-Drp1 antibody (green) and a goat anti-Hsp60 antibody (red), respectively. f–f”’, h–h”’ Enlarged views of the boxed regions in (e–e”’, g–g”’). e”’–h”’ The heat map reflects the fluorescence intensity of “Mito Drp1”. i Pearson’s coefficient indicates colocalization of Drp1 and mitochondria. j The fluorescence intensity in the heat map (e”’, g”’) was quantified to measure “Mito Drp1” levels. i, j Fiji/ImageJ was used for image analysis (mean ± SEM, n = 4 independent experiments). In each experiment, 12–25 cells were measured for each genotype, and the average Pearson’s coefficient (i) or fluorescence intensity (j) was calculated. k–n” Confocal microscopy images showing Drp1 localization. Drp1 and mitochondria are labeled using a mouse anti-Drp1 antibody (green) and by transfection of a plasmid expressing Mito-DsRed (red), respectively. i–i”, n–n” Enlarged views of the boxed regions in (k–k”, m–m”). o Pearson’s coefficient indicates colocalization of Drp1 and mitochondria (mean ± SEM, n = 3 independent experiments). p, q Fractionation of HeLa cell lysates, showing total Drp1 levels (INPUT) and levels of Drp1 in the mitochondrial (Mito) and the cytoplasmic (Cyto) fractions. Western blots were probed with mouse anti-Drp1 and rabbit anti-CLUH antibodies. A mitochondrial protein, Cytochrome c (Cyt c), and a cytoplasmic protein, α-Tubulin, serve as controls. Drp1 levels in the Mito fraction were normalized to total Drp1 levels (mean ± SEM, n = 3 independent experiments). (e–h”’, k–n”) Scale bars: 10 μM. b, d, i, j, o, q Two-sided Student’s t-test.

