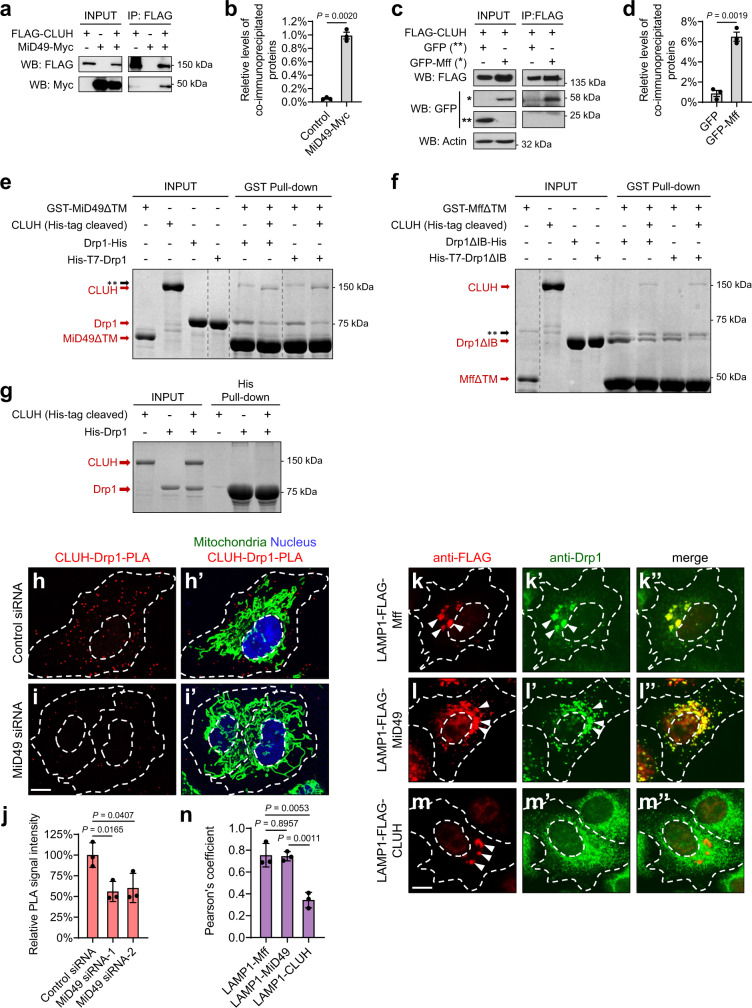
Fig. 7. CLUH directly binds MiD49 and Mff, which mediates the interactions between CLUH and Drp1.
a–d Co-immunoprecipitation using lysates from HeLa cells transfected with the indicated constructs. The INPUT represents 5% (a) and 3% (c) of each total lysate, respectively. Both MiD49-Myc (a, b) and GFP-Mff (c, d) were co-immunoprecipitated with FLAG-CLUH by using a mouse anti-FLAG antibody. Western blots were probed with rabbit anti-FLAG, Myc, GFP, and actin antibodies. The levels of co-immunoprecipitated proteins were normalized to INPUT levels (mean ± SEM, n = 3 independent experiments, two-sided Student’s t-test). e In a cell-free system with recombinant GST- or His-fusions purified from E. coli, MiD49 pulls down both Drp1 and CLUH in vitro. f With purified Mff (isoform-e), CLUH, and Drp1 as INPUT, Mff pulls down both Drp1 and CLUH in vitro. e, f Gray dashed lines delineate the boundaries between non-adjacent lanes in the same gel. The whole gel images are shown in Supplementary Fig. 5b, c. Double asterisks indicate the position of a non-specific band. IB denotes Insert B domain. TM denotes transmembrane domain. All the above experiments were performed without the use of cross-linkers. g Drp1 does not pull down CLUH in vitro. e–g Experiments were repeated independently 3 times, and representative images are shown. h–i’ CLUH-Drp1-PLA (red) was carried out using rabbit anti-CLUH and mouse anti-Drp1 antibodies in HeLa cells transfected with control or MiD49 siRNA. Mitochondria: goat anti-Hsp60 antibody (green). Nucleus: DAPI (blue). j Quantification of CLUH-Drp1-PLA signals. k–m” FLAG-tagged Mff, MiD49 and CLUH fused to LAMP1 are visualized with a rabbit anti-FLAG antibody (red), and Drp1 is visualized with a mouse anti-Drp1 antibody (green). White arrowheads indicate lysosome-localized proteins. n Pearson’s coefficient indicates colocalization of the indicated LAMP1 fusion proteins and Drp1. h–i’, k–m” White dashed lines mark the boundaries of the cells and the nuclei. Scale bars: 10 μM. j, n Fiji/ImageJ was used for image analysis (mean ± SEM, n = 3 independent experiments, one-way ANOVA with post hoc Tukey’s HSD test). In each experiment, 20–30 cells were analyzed for each genotype and the average PLA signal intensities (j) or Pearson’s coefficient (n) was calculated.

