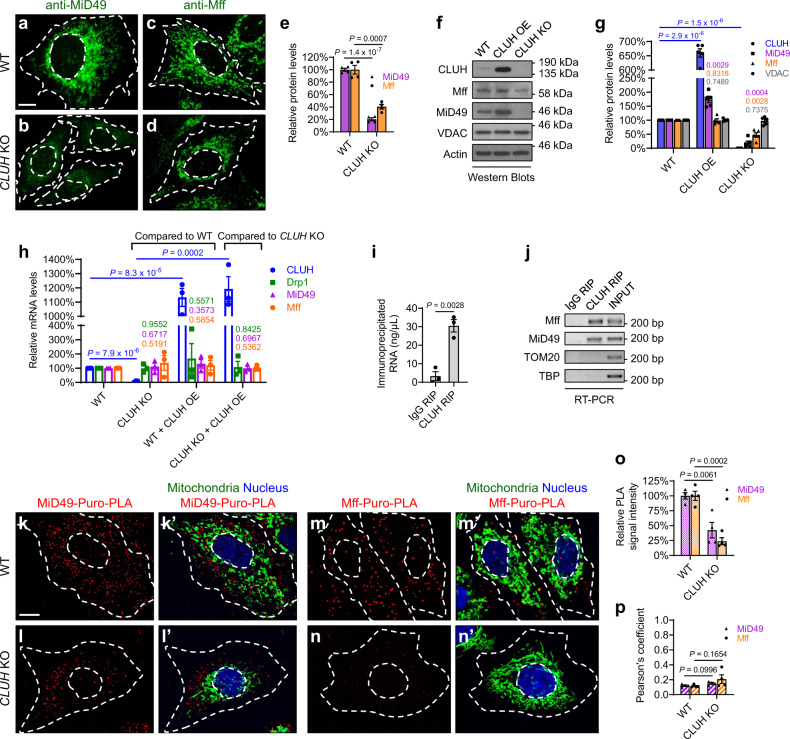
Fig. 8. CLUH controls MiD49 and Mff protein levels through translational regulation in mammalian cells.
a–d Immunofluorescence (IF) staining showing endogenous MiD49 and Mff protein levels in wild-type and CLUH KO cells, using anti-MiD49 and anti-Mff antibodies, respectively. e Quantification of IF signals of MiD49 and Mff, normalized to IF signals of a control mitochondrial protein TOM20 (images not shown) in the same cell, using Fiji/ImageJ. f, g Western blots showing Mff and MiD49 protein levels in response to CLUH overexpression or CLUH KO. VDAC was used as a loading control for mitochondrial mass, and actin was used as a housekeeping protein loading control. Western blot experiments were repeated independently 5 times, with representative images shown in (f) and statistical analysis shown in (g) (mean ± SEM, n = 5). h Quantitative PCR (qPCR) experiments showing Drp1, Mff, and MiD49 mRNA levels in response to CLUH overexpression or CLUH KO. Total RNAs extracted from HeLa cells of the indicated genotypes were used as templates for the synthesis of cDNAs, which were then used as templates for qPCR. Experiments were repeated in triplicate (mean ± SEM, n = 3). i, j RNA Immunoprecipitation (RIP) experiments show that CLUH binds mRNAs of MiD49 and Mff, but not mRNAs of control genes TOM20 or TBP (encoding the nuclear TATA-binding protein). Experiments were repeated in triplicate (mean ± SEM, n = 3), and representative images are shown in (j). k–n’ Puro-PLA was carried out using a mouse anti-puromycin antibody in combination with either a rabbit anti-MiD49 antibody (k–l’) or a rabbit anti-Mff antibody (m–n’) (red). Mitochondria: goat anti-Hsp60 antibody (green). Nucleus: DAPI (blue). o Quantification of relative Puro-PLA signals using Fiji/ImageJ. p Pearson’s coefficient indicates colocalization of Puro-PLA signals and mitochondria. a–d, k–n’ Experiments were repeated independently for 4 times, and representative images are shown (mean ± SEM, n = 4). In each experiment, 20–30 cells were analyzed for each genotype, and the average IF signal intensity (e, o) or Pearson’s coefficient (p) was calculated. Scale bars: 10 μM. e, i, o, p Two-sided Student’s t-test. g, h One-way ANOVA with post hoc Tukey’s HSD test, with P-values displayed in the graphs.

