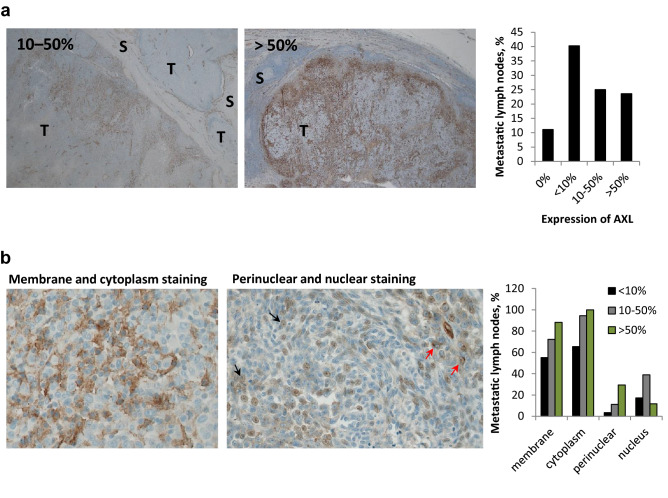
Figure 1.
AXL expression and localization in melanoma lymph node metastases. AXL expression levels in 72 samples of metastatic lymph nodes were evaluated and depending on the expression status assigned into four sub-groups: no expression (0%), lower than 10%, 10–50% and more than 50%. (a) Representative IHC stainings of AXL expression level and localization are presented. Bar graph indicates the % of samples within each sub-group, where a total sample number was set to 100%. (b) Representative IHC staining of AXL within tumor cells, showing membrane and cytoplasm staining (left), and perinuclear and nuclear staining, indicated with red and black arrows, respectively (right). Bar graph indicates the % of AXL positive samples in the indicated cellular compartments within the different scoring sub-groups presented in (a). The total number within each sub-group exceeds 100% since samples may be positive in multiple cellular compartments. T, tumor region; S, stromal region. Images were taken at ×100 (a) or 200x (b) magnification.

