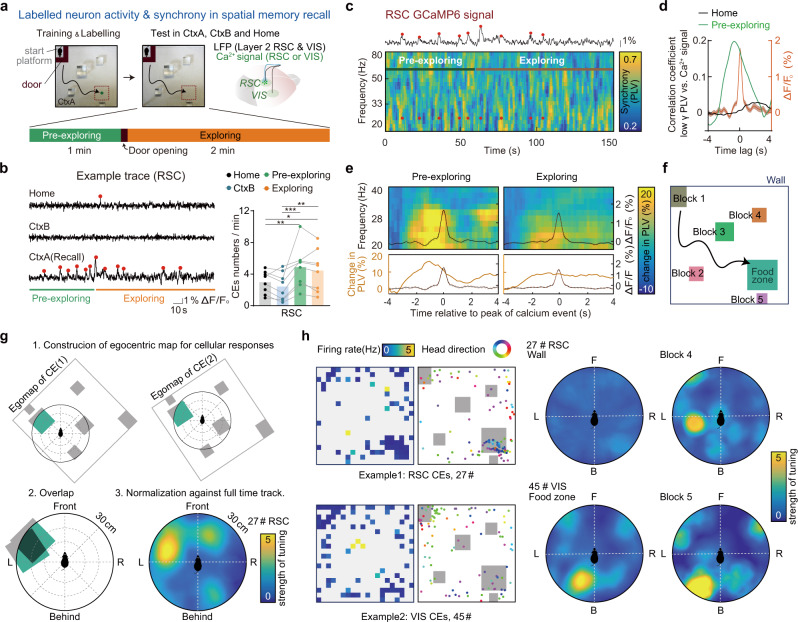
Fig. 5. Activation of the cortical memory-related population was tightly coupled to the long-range cortical gamma synchrony and show egocentric coding to objects in the learned context during memory retrieval.
a–e Cortical gamma synchrony is associated with spatial memory-related neurons activation. a Experiment scheme to monitor the activity of cortical spatial memory-related neurons and the long-range gamma synchrony simultaneously. Activities of memory-related neurons were monitored by calcium signal (GCaMP6f labeled by TRAP using c-Fos-CreER mice during spatial memory task training day4) in RSC or VIS, while LFPs were recorded both in RSC and in VIS. In recall trials (day11), mice were confined on the start platform for 1 min by an L shape door (pre-exploring) before freely exploring in the sandbox (exploring). See other recording details in Supplementary Fig. 14a–d. b Left, examples of RSC calcium signals of labeled neurons. Right, labeled RSC neurons showed context selectivity. Red dots indicate the peaks of the detected RSC calcium events (N = 8 mice, ANOVA, F(3, 15) = 7.1, P = 0.0034, Tukery post-hoc test, PPre-exploring vs. CtxB = 0.007, PPre-exploring vs. Home = 0.0308, PExploring vs. CtxB = 0.0257). c An example of synchrony spectrogram (RSC-VIS) plotted together with calcium signal from labeled RSC neurons, showing the correspondence between engram activity and synchrony. d Cross-correlation analysis. Averaged correlation coefficient between low gamma synchrony and engram activity of RSC (n = 6) in pre-exploring phase (green) and in homecage (black). Orange line, averaged calcium events (n = 263 RSC CEs). e Averaged low gamma synchrony (RSC-VIS) spectrogram. Spectrograms are aligned to each peak (t = 0) of RSC calcium event during the pre-exploring phase or exploring phase. Synchrony was normalized to baseline synchrony of each calcium event (mean PLV from −4s to −3s). The black curve inside the graph shows the averaged curve of all calcium events within pre-freezing or freezing. Bottom, change in synchrony (averaged across low gamma band) and same averaged curve of CEs are plotted for clarity of peak time of the change in synchrony. 133 CEs of RSC within the pre-exploring phase and 263 CEs of RSC within exploring from 6 animals. (VIS calcium signal owns similar properties as RSC, both RSC and VIS signals showed most frequent firing in the pre-exploring phase and coupled to long-range low gamma synchrony. See VIS data in Supplementary Fig. 13). Dash lines plot around the CEs curve show S.D. f–h Labeled neurons in RSC and VIS show egocentric coding to objects in the learned context. f Diagram for definitions of objects in the spatial training context, including entity (walls, block 1–5) and virtual regions (food zone). g Schematic for construction of egocentric object ratemap (EOR) for a specific object, for example, the food zone. h 2D ratemaps of CEs, location of CEs plotted together with head directions (left), and EORs for two examples (right). Firing rate was calculated by total CEs numbers in each bin divided by total time spent in that bin. *P < 0.05, **P < 0.01, ***P < 0.001.

