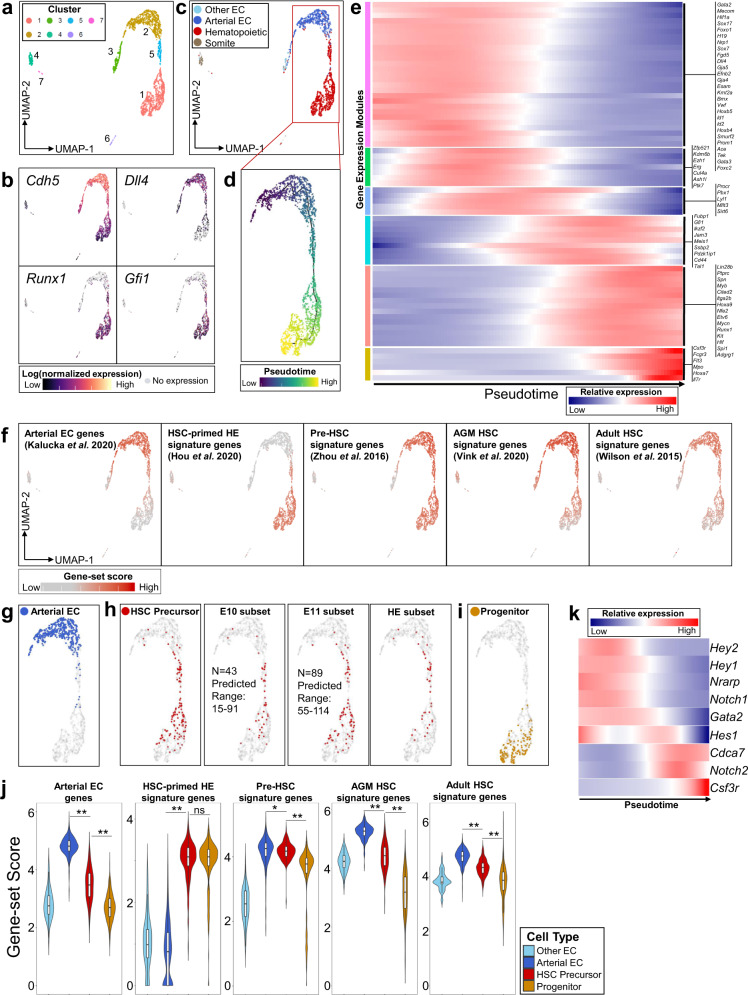
Fig. 3. Single-cell RNA-sequencing of AGM V+61+E+ cells identifies dynamic transcriptional signatures of HSC precursors during their transition from arterial-like HE in vivo.
a UMAP and cluster analysis of sorted E10 to E11 AGM-derived V+61+E+ cells. b Expression heatmap of representative pan-endothelial (Cdh5/VE-Cadherin), arterial (Dll4), and hematopoietic-specific (Runx1, Gfi1) genes. c Cell type classification of single cells based on marker genes (See also Supplementary Fig. 5f). d Trajectory analysis using Monocle to order cells from adjacent clusters (1, 2, and 5) in pseudotime. e Gene expression heatmap of selected differentially expressed genes over pseudotime, segregated by modules of gene expression (See also Supplementary Data 3). f Heatmap of gene-set scores for signature genes defining arterial EC, HSC-primed HE, AGM pre-HSC, E11 AGM HSC, and adult bone marrow HSC, based on previously reported gene sets (see also Supplementary Figs. 6–7, Supplementary Data 6). g–i Cell type classification of single cells based on gene expression (see also Supplementary Fig. 5f): g Arterial EC (co-expressing Cdh5, Dll4, Efnb2, Hey1, not expressing Runx1, Gifi1, Nr2f2, Nrp2), h HSC precursor type (co-expressing Gfi1, Mycn, Pdzk1ip1, Procr, Dll4, Vwf, Cdkn1c, Pbx1, Mllt3, not expressing Flt3, Il7r, Fcgr3, Csf3r), including subset from E10 and E11 data (total numbers of transcriptionally defined HSC precursors and range predicted by functional HSC CFC assay at each stage are indicated, see also Supplementary Fig 4e), and a subset of HSC precursors transcriptionally defined as HE (lacking expression of Itga2b/CD41, Spn/CD43, and Ptprc/CD45). i Progenitor cell type (expressing Runx1 plus one or more of Flt3, Il7r, Fcgr3, or Csf3r). j Gene-set scores for signature genes from (f) in transcriptionally defined cell types (boxplots show median values and interquartile ranges; upper/lower whiskers show 1.5× interquartile range, *p = 0.026; **p < 1E-15; ns p = 0.76, unpaired, two-sided Wilcoxon test). k Gene expression heatmap of Notch receptors and target genes in pseudotime.

