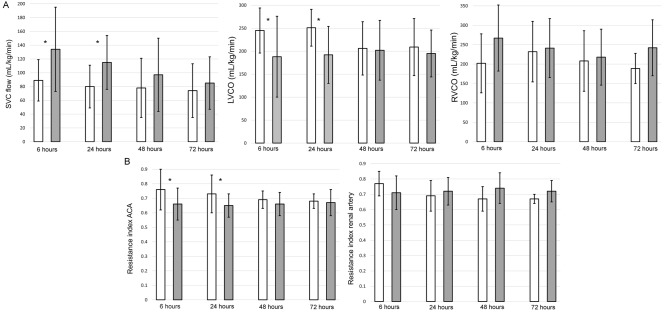
Figure 4.
Bar graph showing the mean echocardiography (A) and Doppler measurements (B) in intrauterine growth restriction (IUGR) (grey) and control (white) newborns at the different time points. Echocardiography and Doppler assessments were not performed in eight infants in the control and three infants in the IUGR group at 72 h. Error bars represent standard deviation. *Statistically significant (P < 0.05). SVC superior vena cava, LVCO left ventricular cardiac output, RVCO right ventricular cardiac output, ACA anterior cerebral artery.

