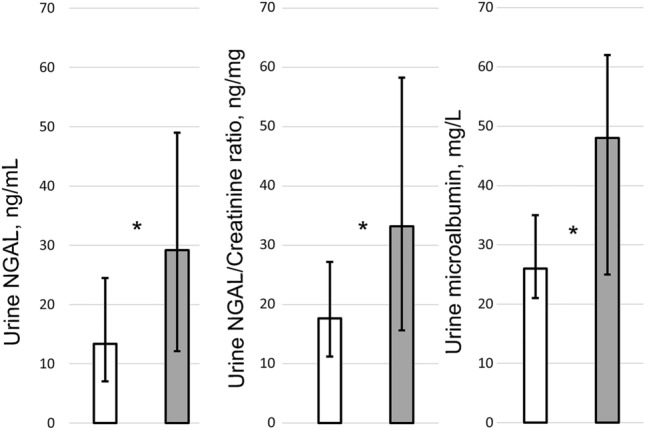
Figure 5.

Bar graph showing the median urinary neutrophil gelatinase-associated lipocalin (NGAL), NGAL/Creatinine and urine microalbumin values in intrauterine growth restriction (IUGR) (grey) and control (white) newborns. Error bars represent the upper and lower quartiles. Paired blood/urine samples were available in 75 IUGR and 66 control newborns. Urine samples alone were available in 6 IUGR and 12 control infants. *Statistically significant (P < 0.05).
