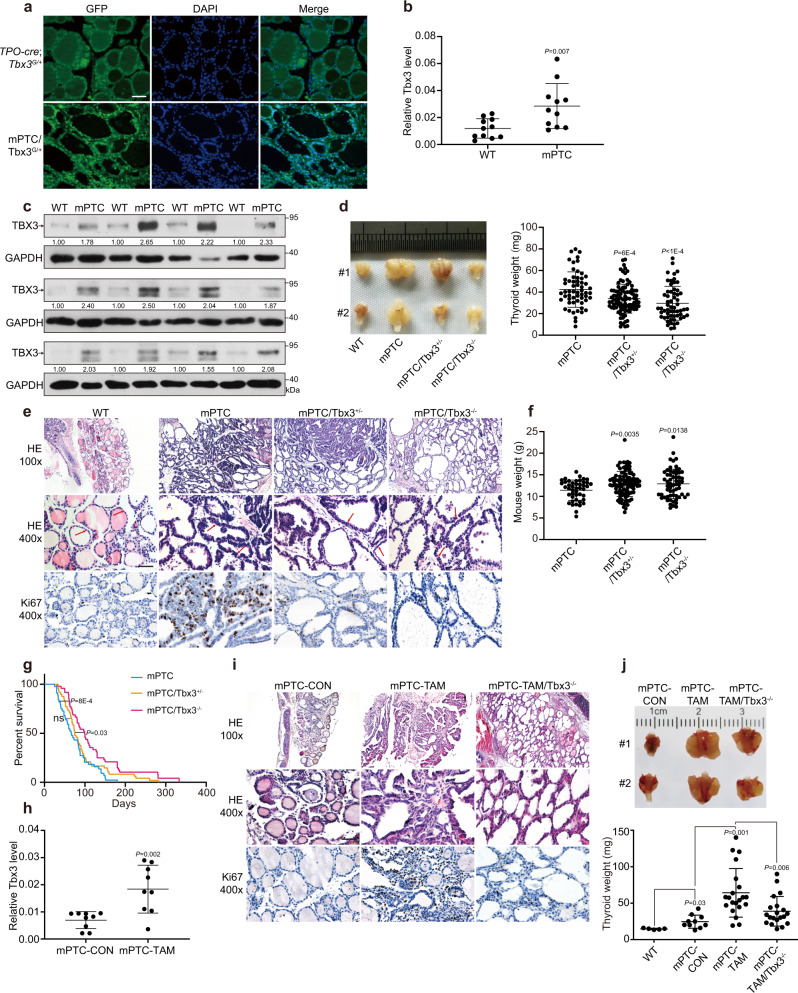
Fig. 1. Tbx3 is necessary for BrafV600E-induced PTC formation.
a Representative images of TBX3-GFP positive cancer cells analyzed by GFP IF staining in mPTC/Tbx3G/+ compared with TPO-cre; Tbx3G/+ littermates at 5w. Scale bars, 50μm. b The expression of Tbx3 was measured by RT-qPCR in thyroid glands from wild-type (WT) and mPTC littermates at 5w, GAPDH was used as the loading control, n = 11 pairs of littermates. c The expression of TBX3 was measured by western blot with densitometric analyses in thyroid glands from WT and mPTC littermates at 5w, n = 12 pairs of littermates. d The image representing whole thyroid tissues from 2 pairs of WT, mPTC, mPTC/Tbx3+/− and mPTC/Tbx3−/− mice at 5w, and related thyroid weight was plotted, n = 58 mPTC, n = 95 mPTC/Tbx3+/−, n = 59 mPTC/Tbx3−/−. e Representative H&E and Ki67 IHC staining on thyroid tissues from WT, mPTC, and mPTC/Tbx3−/− littermates, red arrows points to papillary formations. Scale bars, 50μm. f Mouse weight of mPTC, mPTC/Tbx3+/−, and mPTC/Tbx3−/− mice at 5w, n = 45 mPTC, n = 97 mPTC/Tbx3+/−, n = 60 mPTC/Tbx3−/−. g Survival of mice bearing mPTC, mPTC-Tbx3+/− or mPTC-Tbx3−/−, n = 44 mPTC, n = 48 mPTC/Tbx3+/−, n = 48 mPTC/Tbx3−/−. h RT-qPCR analysis of Tbx3 in thyroid tissues from TPO-creER; BrafV600ECA with intraperitoneal tamoxifen injection at 1 m (mPTC-TAM) or oil treatment as control (mPTC-CON), each pair of tissue was obtained at same time, n = 9. i Representative H&E and Ki67 IHC staining on thyroid tissues from mPTC-CON, mPTC-TAM or mPTC-TAM/Tbx3−/−. Scale bars, 50μm. j Representative images of whole thyroid tissues from mPTC-CON, mPTC-TAM or mPTC-TAM/Tbx3−/− at 8 m after intraperitoneal tamoxifen injection, n = 5 WT, n = 10 mPTC-CON, n = 21 mPTC-TAM, n = 20 mPTC-TAM/Tbx3−/−. Thyroid tissue weights were analyzed. n = 3 biological independent samples (a, e, i). Data are shown as the mean ± s.d. (b, d, f, h, j). P values were calculated by unpaired two-tailed Student’s t test (b, d, f, h, j) or Logrank (Mantel-Cox test) (g). Uncropped immunoblots and statistical source data are provided in Source Data.

