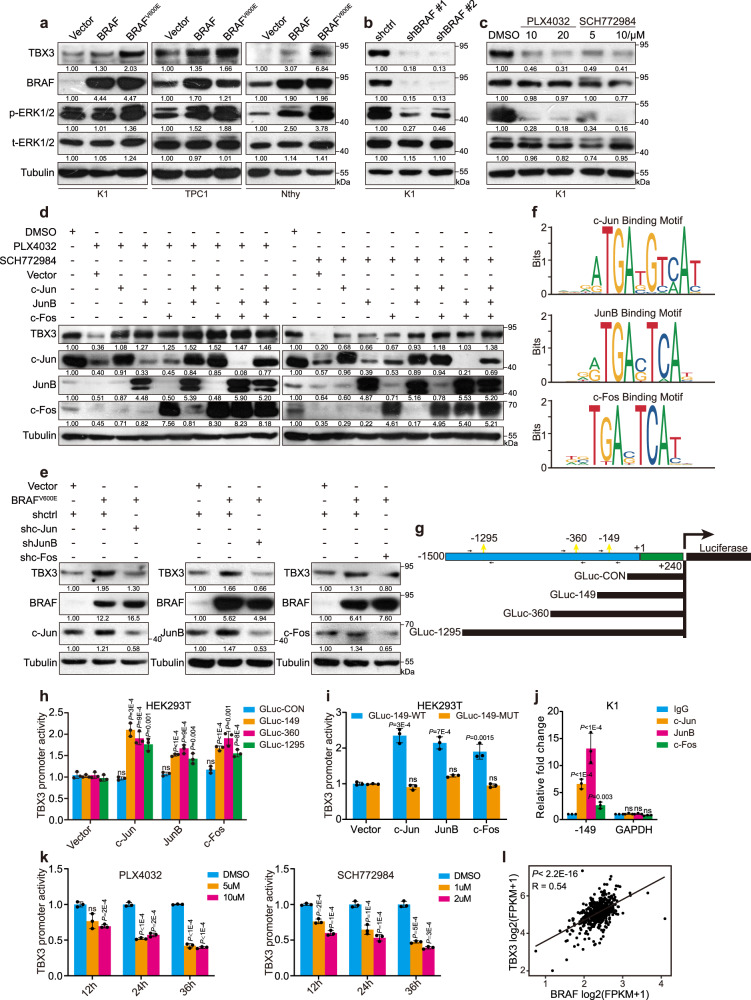
Fig. 2. BRAF/MAPK/AP-1 axis promotes TBX3 transcription in PTC.
a, b Western blot of TBX3 in PTC or normal thyroid cells (Nthy-ori-3-1) with BRAF or BRAFV600E over-expression (a) or K1 cells with BRAF knock-down (b). c K1 cells were treated with BRAF inhibitor PLX4032 or ERK1/2 inhibitor SCH772984 for 24 h, the level of TBX3 was analysis by western blot. d TBX3 and AP-1 factors levels in K1 cells over-expressing c-Jun, JunB, or c-Fos, and treated with PLX4032 or SCH772984. e TBX3 and AP-1 factors levels in K1 cells with BRAFV600E over-expression and AP-1 knock-down. f AP-1 binding motifs were analyzed through TBX3 promoter region using Jasper database. g Construction of TBX3 promoter GLuc with potential AP-1-binding sites. The predicted -358bp and -362bp site were overlapped as -360bp site. Arrows represented primers were used for qPCR. h, i Promoter GLuc activities were analyzed in HEK293T cells co-transfected with TBX3 truncated promoter (h) or TBX3-149-MUT promoter (i) and AP-1 expression constructs. j Quantitative ChIP (qChIP) analysis with anti-IgG, c-Jun, JunB and c-Fos for -149 site in K1 cells, primers targeting GAPDH gene were used as control. k Luciferase activities of GLuc-149 were analyzed in K1 cells treated with PLX4032 or SCH772984 for 12 h, 24 h or 36 h. l THCA datasets were downloaded from TCGA database to analyze the correlation between TBX3 and BRAF, n = 501. Densitometric analyses of western blot were shown (a–e). Two independent experiments were carried out with similar results for each kind of cells (a–c), and n = 3 biological independent samples (d, e, h–k). Data are shown as the mean ± s.d. (h–k). P values were calculated by unpaired two-tailed Student’s t test (h–k). Uncropped immunoblots and statistical source data are provided in Source Data.

