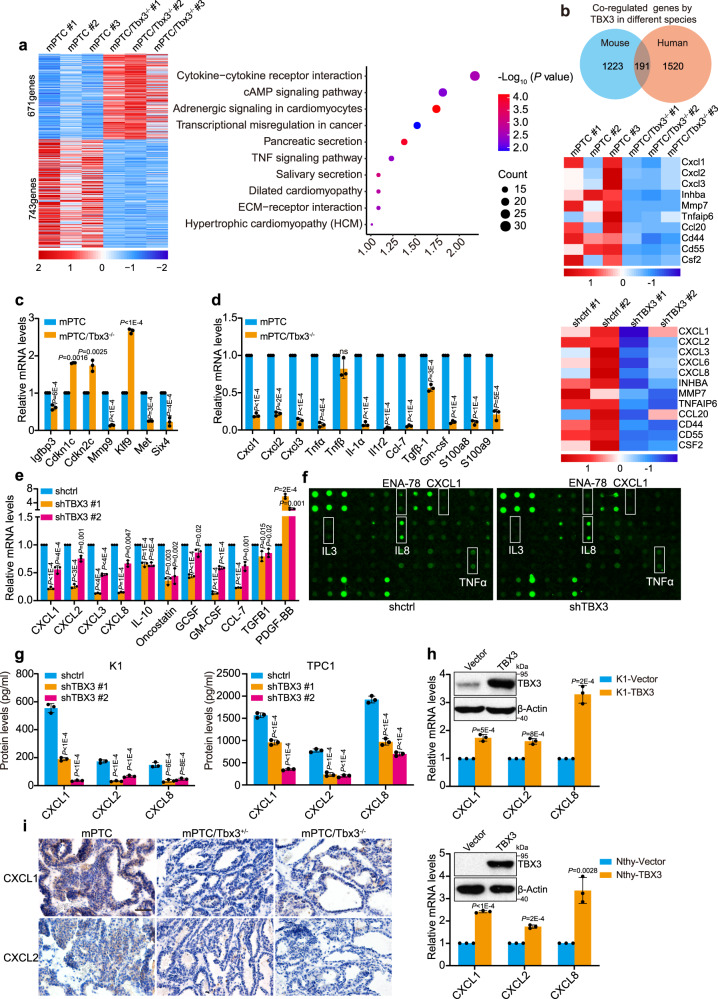
Fig. 3. Loss of TBX3 leads to CXCR2 ligands reduction.
a Heatmap representation of DEGs (fold change >1.5; P < 0.05) in tumor tissues from mPTC and mPTC/Tbx3−/−. The right panel showed the KEGG pathway analysis of DEGs. Data were analyzed using DAVID 6.8 website. b Venn diagram analysis across two groups of DEGs from mPTC tissues versus human K1 cells due to TBX3 loss. The heatmap of regulated genes was analyzed according to venn diagram, the upper for mouse and the lower for human. Differentially expressed human genes: 706 up-regulated genes and 1004 down-regulated genes. c The expression of genes from mPTC RNA-seq was confirmed by RT-qPCR. d, e RT-qPCR confirmation of inflammatory factors among DEGs from mPTC tissue (d) or human K1 cells (e) RNA-seq. f Cytokine antibody array on cell culture media from K1 cells with TBX3 knock-down. g ELISA analysis of CXCL1, 2 and CXCL8 in cell culture media from K1 or TPC1 cells with TBX3 knock-down. h RT-qPCR analysis of CXCL1, 2 and CXCL8 in K1 and Nthy cells with TBX3 over-expression. i IHC staining of CXCL1 and CXCL2 in mPTC, mPTC/Tbx3+/− and mPTC/Tbx3−/−. Scale bars, 50μm. n = 3 biological independent samples (c–e, g–i). Data are shown as the mean ± s.d. (c–e, g, h). P values were calculated by unpaired two-tailed Student’s t test (c–e, g–h). Uncropped immunoblots and statistical source data are provided in Source Data.

