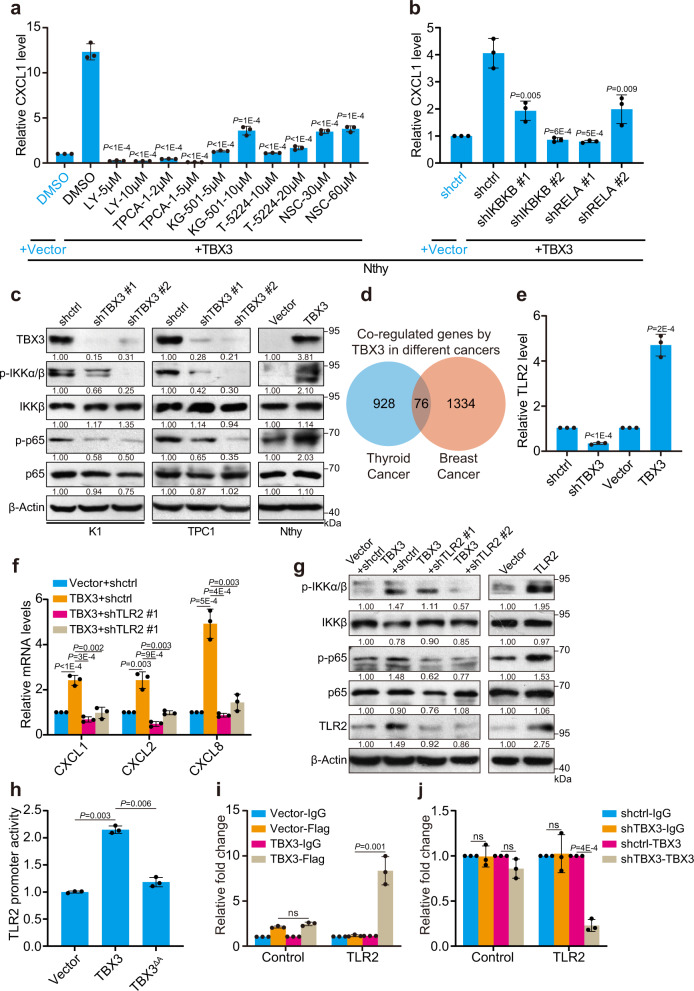
Fig. 4. TBX3/TLR2-NF-κΒ axis induces chemokines expression.
a CXCL1 mRNA level in TBX3 over-expressed Nthy cells treated with small-molecule inhibitors against IKKβ (LY2409881 (LY), TPCA-1), CREB (KG-501), AP-1 (T-5224) or STAT3 (NSC74859 (NSC)) was measured by RT-qPCR, comparison between DMSO- and inhibitor-treated TBX3-over-expressed Nthy cells was used for statistical analyses. b RT-qPCR analysis of CXCL1 in TBX3 over-expressed Nthy cells infected with shRNAs against IKBKB or RELA, comparison between shctrl- and shRNA- TBX3-over-expressed Nthy cells was used for statistical analyses. c Western blot of NF-κB pathway members in K1, TPC1 with TBX3 knock-down, and Nthy cells with TBX3 over-expression. d Venn diagram analysis across two groups of genes. Down-regulated, shTBX3 versus control in K1 cells (n = 1004); Up-regulated, TBX3 over-expression versus control in 21NT breast cancer cells (n = 1410). e RT-qPCR analysis of TLR2 in K1 cells with TBX3 knock-down or over-expression. f RT-qPCR analysis of CXCL1, 2 and CXCL8 in TBX3 over-expressed K1 infected with shRNAs against TLR2. g Western blot of NF-κB pathway members in K1 cells as in (f). h HEK293T cells were co-transfected with TLR2-GLuc, TBX3 and TBX3 with activator domain deletion (TBX3ΔA) assayed for GLuc activity using SEAP activity as control. i qChIP analysis using anti-IgG and anti-FLAG antibody was performed in K1 cells with Flag-TBX3 over-expression. j qChIP analysis using anti-IgG and anti-TBX3 antibody was performed in K1 cells with TBX3 knock-down. Densitometric analyses of western blot were shown (c, g). n = 3 biological independent samples (a, b, e–j), and two independent experiments were carried out with similar results for each kind of cells (c). Data are shown as the mean ± s.d. (a, b, e, f, h–j). P values were calculated by unpaired two-tailed Student’s t test (a, b, e, f, h, j). Uncropped immunoblots and statistical source data are provided in Source Data.

