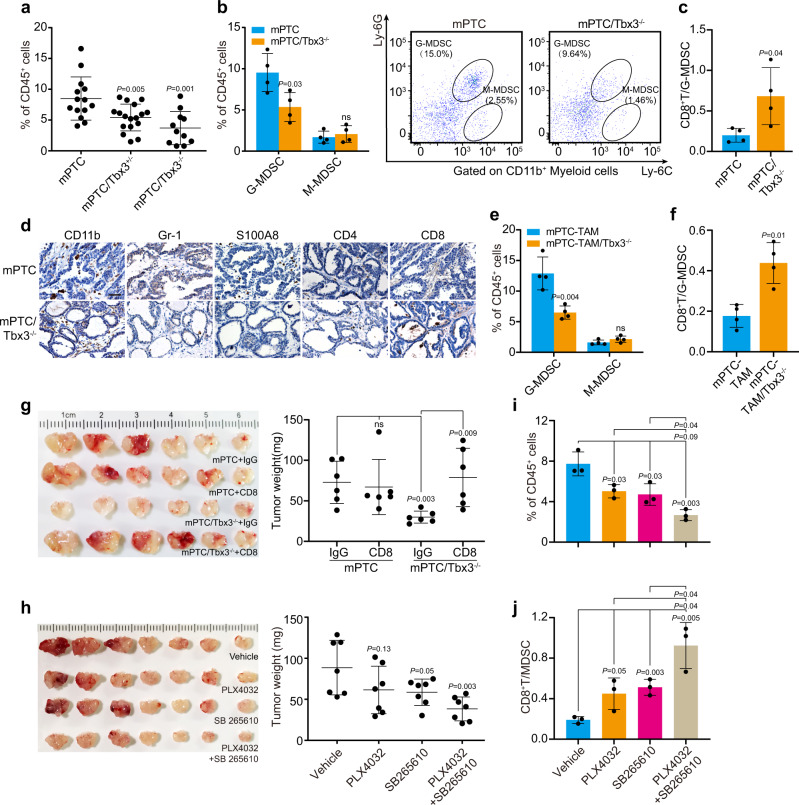
Fig. 6. TBX3 deficiency blocked tumor formation due to suppressed CXCR2-mediated MDSCs recruitment.
a Flow cytometric analysis of MDSCs (CD45+CD11b+Gr-1+) in thyroid glands from mPTC (n = 14), mPTC/Tbx3+/− (n = 17) or mPTC/Tbx3−/− (n = 11) littermates at 5w. b, c Percentage of G-MDSC (CD45+CD11b+Ly6C-Ly6G+) and M-MDSC (CD45+CD11b+Ly6C+Ly6G-) of CD45+ tumor-infiltrating leukocytes (TILs) in mPTC tumors compared with mPTC/Tbx3−/− littermates at (b). Relative CD8+ T cells/MDSCs was plotted (c), n = 4. d IHC analysis of CD11b, MDSCs (Gr-1, S100A8), CD4+ T cells (CD4) and CD8+ T cells (CD8) in thyroid glands from mPTC/Tbx3−/− compared with mPTC littermates. Scale bars, 50μm. e, f Flow cytometric analysis of G-MDSC and M-MDSC in mPTC-TAM or mPTC-TAM/Tbx3−/− tumors induced with tamoxifen for 8 m. CD8+ T cells/MDSCs was plotted, n = 4. g Mice bearing mPTC and mPTC/Tbx3−/− tumors were treated with 200 μg anti-CD8 antibody per mouse twice weekly at age of 3w for 20d. Tumor weights were counted, n = 6. h Mice bearing tumors received daily oral doses of PLX4032 10 mg/kg body weight or SB265610 2 mg/kg body weight at age of 3w for 20d. Tumor weights were counted, n = 7. i, j Flow cytometric analysis of mPTC tumors underwent above treatments. Percentage of positive cells relative to total cells was plotted. MDSCs (i) and CD8+ T cells/MDSCs (j), n = 3. A representative of three independent experiments was shown (d). Data are shown as the mean ± s.d. (a–c, e–j). P values were calculated by unpaired two-tailed Student’s t test (a–c, e–j). Statistical source data are provided in Source Data.

