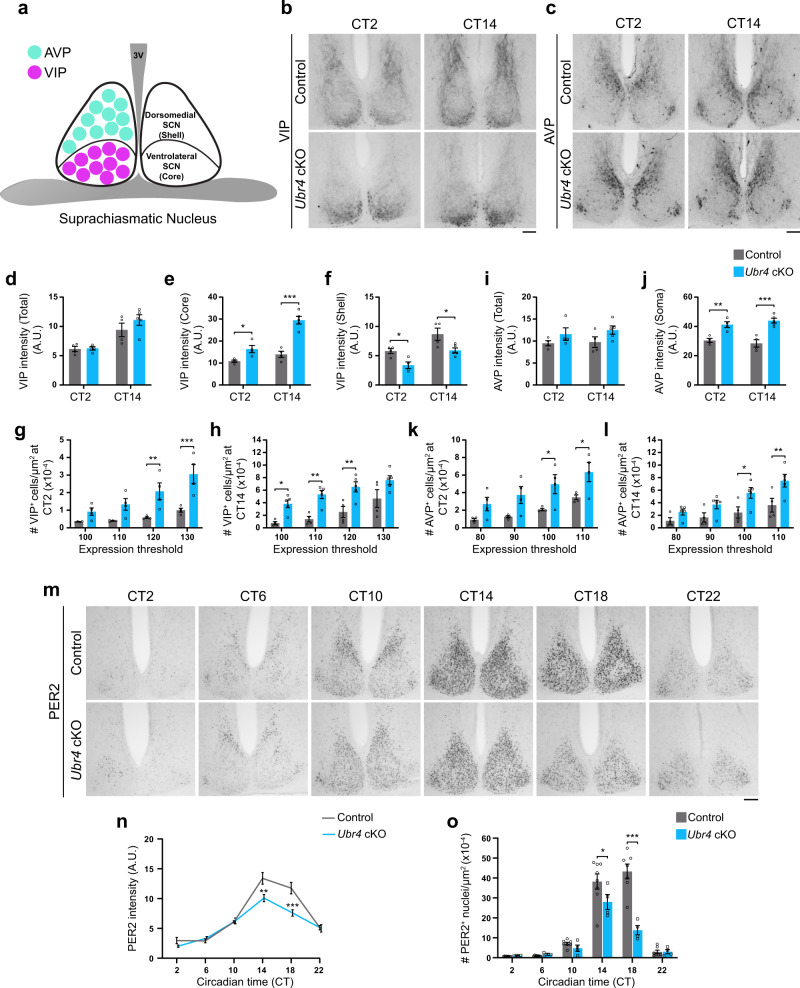
Fig. 3. UBR4 is essential for the proper trafficking of VIP and AVP in the SCN and for mPER2 expression.
a Schematic depicting the location of AVP and VIP neurons in the SCN. b, c, m Photomicrographs of VIP (b), AVP (c), and mPER2 (m) immunoreactivity in the SCN of control and Ubr4 cKO mice at defined CTs. Scale bar, 100 μm. d–f Immunoreactive intensity of VIP in the whole (d), core (e), or shell (f) SCN. g, h Density of VIP-IR cells in the SCN at CT 2 (g) or CT 14 (h) as a function of expression intensity. i, j Immunoreactive intensity of AVP in the whole SCN (i) or in the soma of shell SCN neurons (j). k, l Density of AVP-IR cells in the SCN at CT 2 (k) or CT 14 (l) as a function of expression intensity. Low threshold values (on the x-axis in g, h, k, l) indicate strong expression, whereas high threshold values indicate weak expression. n = 4 control (CT 2 and CT 14), 4 Ubr4 cKO (CT 2), 5 Ubr4 cKO (CT 14) (d–l). *p = 0.048, ***p < 0.0001 (e); *p = 0.0449 (CT 2), *p = 0.0159 (CT 14) (f); **p = 0.0058, ***p = 0.0002 (g); *p = 0.0378, **p = 0.0052 (110), **p = 0.0044 (120) (h); **p = 0.0037, ***p = 0.0001 (j); *p = 0.0329 (100), *p = 0.0338 (110) (k); *p = 0.0438, **p = 0.008 (l). n Immunoreactive intensity of mPER2 in the whole SCN. n = 8 control and 4 Ubr4 cKO; **p = 0.0083, ***p = 0.0005. o Density of mPER2-IR cells in the SCN. In ascending order of CT: n = 8, 8, 7, 8, 7, 7 for control; n = 4, 3, 4, 4, 4, 4 for Ubr4 cKO. *p = 0.0233, ***p < 0.0001. Values represent mean ± SEM. “n” represents the number of mice. Two-way ANOVA with Bonferroni’s post hoc. A.U. arbitrary units.

