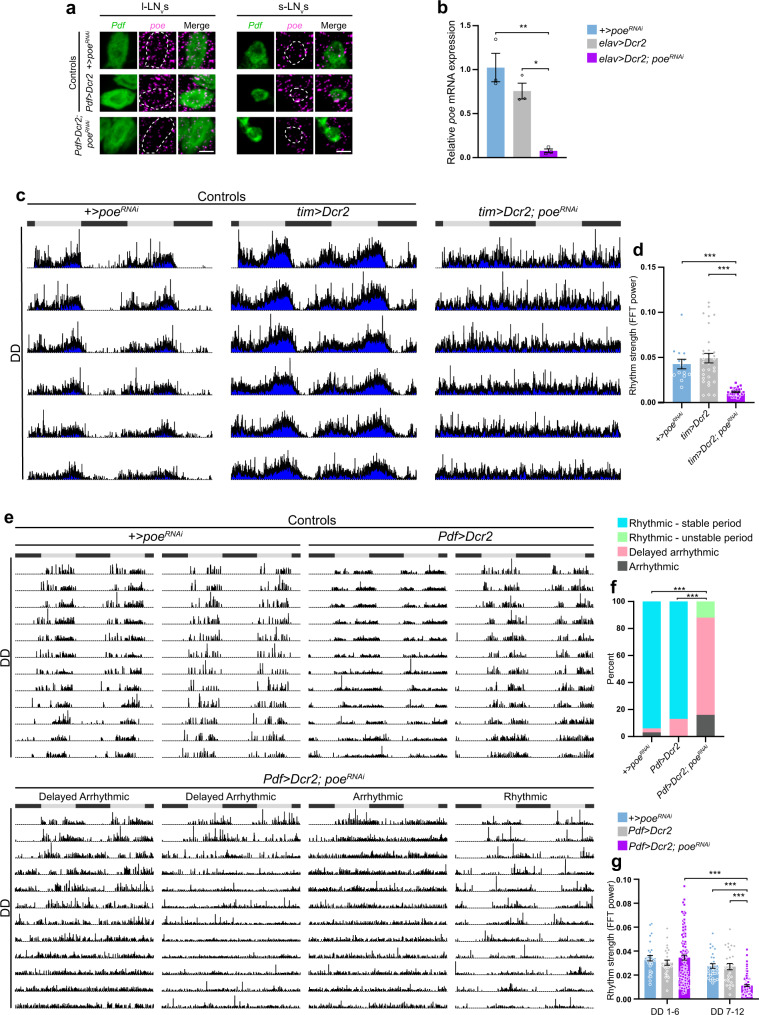
Fig. 4. Poe knockdown in D. melanogaster clock neurons impairs behavioral rhythms under constant darkness.
a In situ hybridization analysis of Pdf (green) and poe (magenta) mRNA expression in l-LNvs and s-LNvs. Scale bar, 5 μm. b qRT-PCR analysis of relative poe mRNA expression in whole fly brains of +>poeRNAi, elav>Dcr2, and elav>Dcr2; poeRNAi flies. n = 3 samples per group; *p = 0.0127, **p = 0.0024, one-way ANOVA with Bonferroni’s post hoc. c Averaged actograms displaying activity rhythms of tim>Dcr2; poeRNAi flies and controls under DD. d Rhythm strength (FFT power) of tim>Dcr2; poeRNAi flies and controls under DD. n = 14 +>poeRNAi, 31 tim>Dcr2, 31 tim>Dcr2; poeRNAi. ***p < 0.0001, Kruskal–Wallis with a Dunn’s post hoc. e Individual actograms displaying activity rhythms of Pdf>Dcr2; poeRNAi flies and controls under DD. Gray and black bars represent the light and dark phases, respectively, of the previous LD schedule (c, e). f Percentage of Pdf>Dcr2; poeRNAi flies and controls displaying different behaviors under DD. n = 31 +>poeRNAi, 30 Pdf>Dcr2, 111 Pdf>Dcr2; poeRNAi. ***p < 0.0001, two-sided chi-square test. g Rhythm strength of Pdf>Dcr2; poeRNAi flies and controls during the first (DD1-6) and second (DD7-12) week of DD. n = 30 +>poeRNAi, 28 Pdf>Dcr2, 104 Pdf>Dcr2; poeRNAi. ***p < 0.0001, linear mixed-effects modeling with Bonferroni’s post hoc. Values represent mean ± SEM (b, d, g) or percent (f). “n” represents the number of samples (b) or the number of flies (d, f, g).

