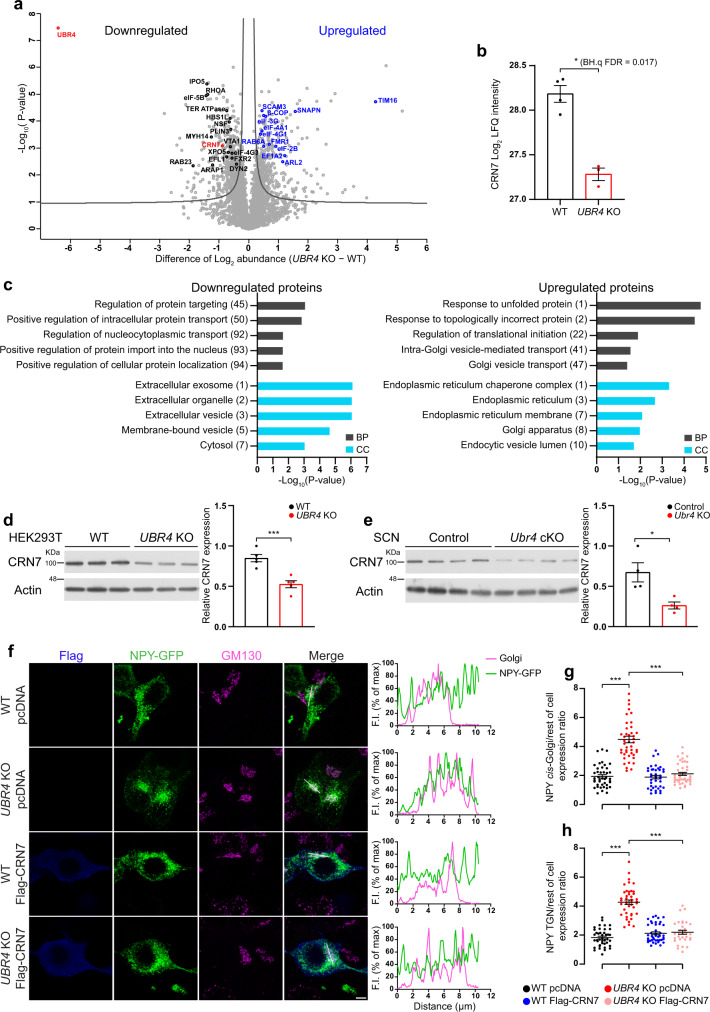
Fig. 7. UBR4 regulates the abundance of Coronin 7 to promote cargo export from the Golgi.
a Volcano plot showing proteins that are differentially expressed in UBR4 KO HEK293T cells relative to WT controls (two-tailed unpaired t test with a Benjamini-Hochberg (BH) adjustment, BH.q FDR < 0.05, S0 = 0.1). Proteins involved in vesicular trafficking or mRNA translation are highlighted in black or blue. b Log2 LFQ intensity values for CRN7. n = 4 WT and 3 UBR4 KO. Two-tailed unpaired t test with Benjamini-Hochberg FDR set at 0.05. BH.q FDR = 0.017. c FAT GO enrichment analysis of differentially expressed proteins in UBR4 KO HEK293T cells. Biological process, BP. Cellular component, CC. The number in parenthesis indicates the position of the corresponding term in the ranked list (one-sided Fisher’s exact test, p < 0.05). d, e Western blot of endogenous CRN7 in UBR4 WT and KO HEK293T cells (d) or SCN tissues of control and Ubr4 cKO mice (e). Graphs show relative CRN7 expression normalized to actin. n = 5 (d) or 4 (e) per genotype. ***p = 0.0009 (d), *p = 0.0174 (e), two-tailed unpaired t test. f NPY-GFP (green) and GM130 (magenta) immunofluorescence in UBR4 WT and KO HEK293T cells transfected with either pcDNA empty vector or Flag-CRN7 (blue). Profile plots (right) show NPY-GFP and GM130 fluorescence intensity (F.I.) along the reference axis (white line, merged panel). Scale bar, 5 μm. g, h Ratio of NPY-GFP abundance in the cis-Golgi (g) or TGN (h) relative to the rest of the cell. n = 42 (g) or 41 (h) for WT pcDNA, n = 43 for UBR4 KO pcDNA, n = 40 (g) or 42 (h) for WT Flag-CRN7, n = 43 (g) or 32 (h) for UBR4 KO Flag-CRN7. ***p < 0.0001, Kruskal–Wallis with a Dunn’s post hoc (g) or one-way ANOVA with Bonferroni’s post hoc (h). Values represent mean ± SEM. “n” represents the number of samples (b, d), the number of mice (e), or the number of cells (g, h).

